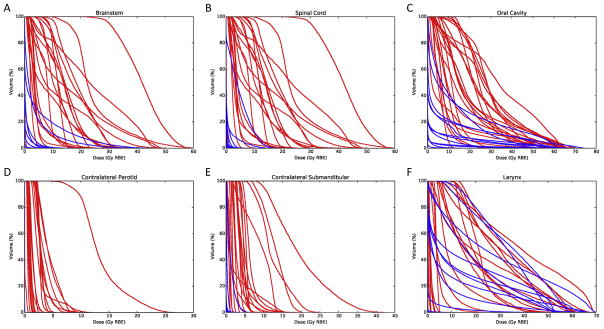
Fig. 1.
Dose–volume histograms of organs at risk for proton (blue) and photon (red) patients: (A) brainstem, (B) spinal cord, (C) oral cavity, (D) contralateral parotid gland, (E) contralateral submandibular gland, (F) larynx. (For interpretation of the references to color in this figure legend, the reader is referred to the web version of this article.)

