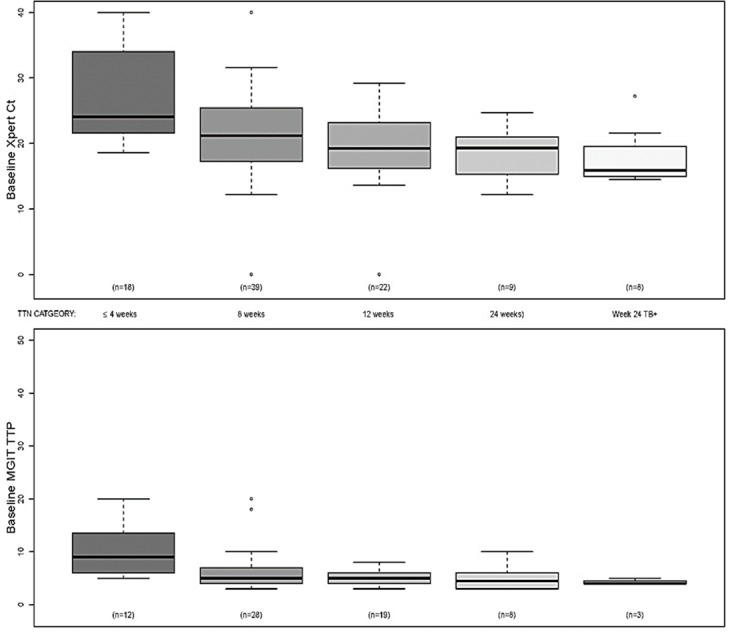
Fig 3. Baseline Xpert and MGIT results and time to culture negativity.

The mean, upper and lower mid quartiles, standard deviations, and outliers of the baseline Xpert Ct (top) and baseline MGIT TTP (bottom) are shown for subjects who converted their culture at the indicated time points. All culture negative samples reported as negative at day 42 by MGIT instrument were assigned a TTP value of 45 and all negative Xpert assays were assigned a Ct value of 40. It should be noted that approximately one third of MGIT TTP findings were excluded from the analysis either due to culture contamination or sputum aliquot inconsistencies.
