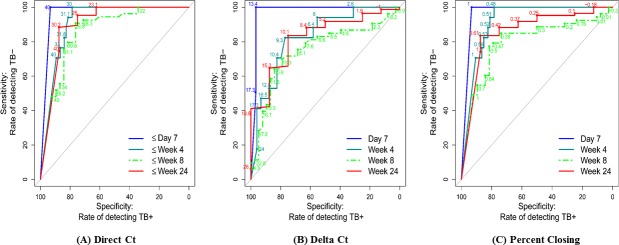
Fig 4. ROC curve for direct Xpert CT, delta CT and percent closing relative to culture negativity at the same time point.
Assessment of direct Xpert Ct (A), delta Ct (B) and percent closing (C) values to predict the same-day culture negativity at day 7, week 4, week 8, and week 24. ROC curve results for direct Xpert Ct (optimal cut off approximately ≥30) at Day 7, AUC = 96.7 (95% CI 94.1, 99.3); at week 4, AUC = 91.2 (95% 85.8, 96.6); and week 8 AUC = 86.0 (95% 77.9, 94.2) and at week 24, AUC = 90.2 (95% 75.0, 100.0). ROC curve results for the delta Ct (optimal cut off values of approximately ≥ 10) at day 7, AUC = 97.5 (95% CI 94.5, 100.0); at week 4, AUC = 82.8 (95% 72.5, 93.1); at week 8, AUC = 75.2 (95%CI 64.8, 85.6); and at week 24, AUC = 82.2 (95%CI 67.9, 96.5). ROC curve results for the percent closing of the baseline Ct deficit at day 7, AUC = 96.6 (95% CI 94.0, 99.2); week 4, AUC = 91.6 (95%CI 86.2, 96.9); week 8, AUC = 79.8(70.3, 89.4); and at week 24, AUC = 86.0 (95%CI 71.3, 100.0).

