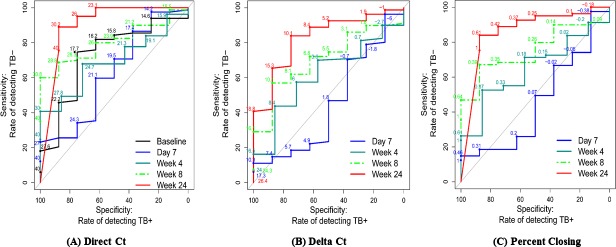
Fig 5. ROC curve for baseline Ct, direct Ct, delta Ct and percent closing deficit to predict treatment failure at the end of the treatment.
Evaluation of ROC curves for direct Xpert Ct showed AUC = 80.2 (95%CI 69.2, 91.3) at week 8, and AUC = 90.2 (95%CI 75.2, 100.0) at week 24. ROC curves for delta Ct demonstrated AUC = 70.2 (95%CI 54.1, 86.2) at week 8 and AUC = 82.6 (95% CI 68.1, 97.0) at week 24. ROC curves for the percent closing deficits at week 8, AUC = 75.2 (95%CI 62.2, 88.1) and at week 24, AUC = 86.2 (95%CI 71.6, 100.0).

