
Fig 6. Combined measures of Ct plus percent closing to predict treatment success versus treatment failure.
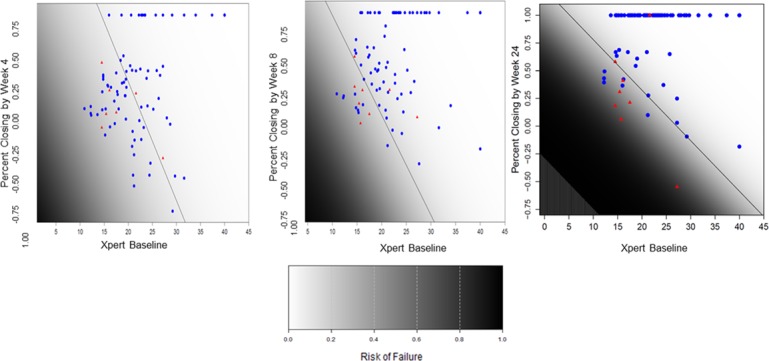
This figure represents a model that include only two covariates: baseline Xpert Ct and percent closing at 4, 8 and 24 weeks (for panels a, b and c respectively). Optimal thresholds are then defined using Youden’s index (on the risk scores provided from the logistic regression models), with sensitivity and specificity estimates derived from application of leave-on-out cross-validation. The Xpert Ct and percent closing measure for each cured case (blue dots) and each treatment failure case (red dots) are shown. The optimal thresholds to predict treatment success and treatment failure using both Xpert Ct and percent closing at each time point are indicated by a diagonal black line. Color gradation from black to white indicate increase chances of culture negativity. Cross validated results using combination of a direct Xpert Ct and percent closing using Youden’s index to predict treatment failure showed 71.4% sensitivity and 42.5% specificity at week 4, 62.5% sensitivity and 84.0% specificity at week 8, and 75% sensitivity 88.9% specificity at week 24.