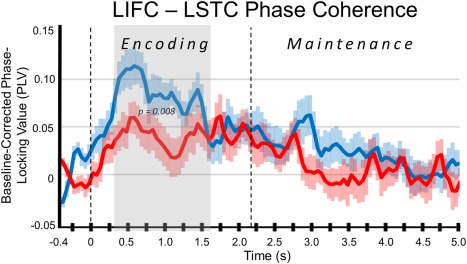
Figure 5.

Connectivity time course for the left inferior frontal and left superior temporal clusters. Mean baseline‐corrected phase‐locking value for connectivity between the left inferior frontal cluster (LIFC) and the left supramarginal gyrus/superior temporal cluster (LSTC) in the 9–16 Hz frequency band is shown on the y‐axis. Time appears on the x‐axis in seconds (s). The connectivity time course for patients with PD is shown in red, whereas that for controls appears in blue. As shown in the gray area, connectivity significantly diverged between groups during early encoding, and this difference lasted for the majority of the encoding phase, with controls having significantly stronger phase‐coherence (connectivity) relative to patients with PD (0.3–1.6 s; p = 0.008). Note that the negative phase‐locking values (patients only) indicate time points where connectivity between these regions was weaker than that observed during the baseline period (−0.4 to 0.0 s). [Color figure can be viewed in the online issue, which is available at http://wileyonlinelibrary.com.]
