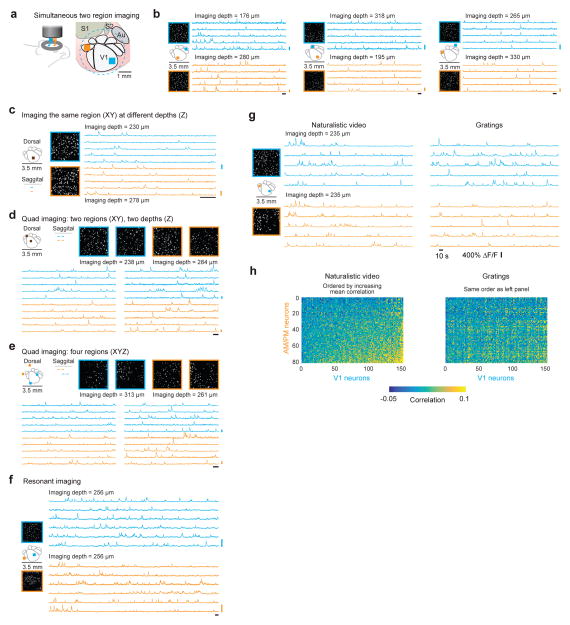
Figure 4. Temporally multiplexed, independently repositionable imaging pathways for simultaneous scanning two regions.
(a) The individual imaging regions can be independently positioned and repositioned anywhere within the full FOV. (b) Within the same session, without moving the mouse or the microscope, the two pathways were moved to various configurations (left) to image neuronal activity (3.8 frames/s per region) (left, segmented active ROIs within the 500 μm imaging region; right, five example traces from each region). (c) There is no lower limit to the XYZ separation between imaging pathways (from the mechanical point-of-view). In this imaging session (9.5 frames/s per region), the XY locations were identical and the pathways only differed in the Z depth (left, segmented active ROIs within the 500 μm imaging region; right, five example traces from each region; Supplementary Video 5). (d, e) By combing temporal multiplexing (Pathways 1 and 2) with serially changing the offset voltage on the galvanometer scanner, four regions can be rapidly imaged (10 frames/s per region). (d) Pathway 1 and 2 are positioned at the same XY location and offset in Z. The galvanometers serially position the imaging region (of each pathway) anywhere within the larger field of view (left, segmented active ROIs within the 400 μm imaging region; right, five example traces from each region; Supplementary Video 6) (e) Pathway 1 and 2 are positioned at different XY locations as well as offset in Z. The galvanometers serially position the imaging region (of each pathway) anywhere within the larger field of view (left, segmented active ROIs within the 400 μm imaging region; right, five example traces from each region). (f) Resonant scanning was performed for faster frame rates (30 frames/s per region) (left, segmented active ROIs within the 500 μm imaging region; right, six example traces from each region; Supplementary Video 7). (g) Neuronal activity was imaged in two regions (20 frames/s per region), V1 and in an ROI encompassing retinotopically matched regions of AM and PM, simultaneously. Visual stimuli, either drifting gratings or a naturalistic movie, were used to evoke responses (left, segmented active ROIs within the 400 μm imaging region; right, five example traces from each region and for each visual stimulus). (h) Ca2+ signals were used to infer spike times and examine correlations. Activity correlations were measured between pairs of cells, each pair consisting of a V1 neuron and a neuron in AM or PM. These correlations were higher during presentation of the naturalistic movie compared to those during the drifting gratings (cross correlation with gratings, mean ± SEM: 0.0157 ± 0.0003; with naturalistic movie: 0.0218 ± 0.0003; N = 12,160 neuron pairs; P < 10–10; rank-sum test). The neurons on both axes were ordered from low to high average correlation for presentation clarity on the left (naturalistic movie), and the same ordering is used on the right (gratings). Imaging depth for both pathways was 235 μm. For all panels the vertical scale bar is 200% ΔF/F and the horizontal scale bar is 10 s. All imaging depths are indicated in the panels. The depth offset in Pathway 2 (orange) was accomplished using the tunable lens.

