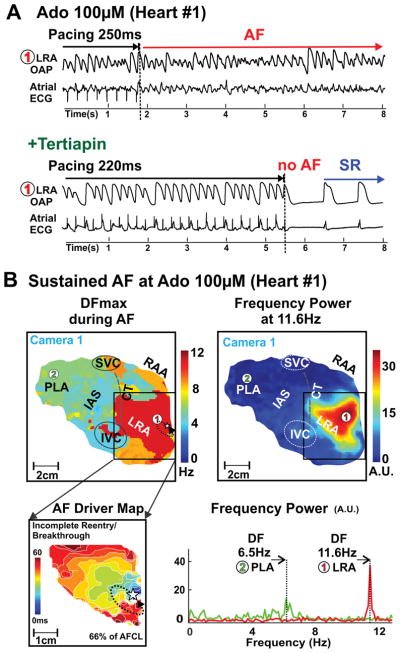
Figure 3. Adenosine-induced AF in human Heart #1(947202).
A, Atrial optical action potentials (OAPs) from location #1 and atrial ECG recordings during and after burst pacing at 100μM adenosine (top) followed by 10nM tertiapin (bottom) perfusion. B, Dominant frequency (top left) and frequency power map (top right) during 100μM adenosine-induced AF. Bottom left, activation map of the AF driver region. Dashed arrow shows AF driver location in region of highest DF. Star shows breakthrough location. Bottom right, Fast Fourier Transform analysis of OAPs #1 and #2 from max DF in LA and RA. AF- Atial Fibrillation; DF-Dominant frequency; SR – sinus rhythm. Abbreviations as in Figure 1.

