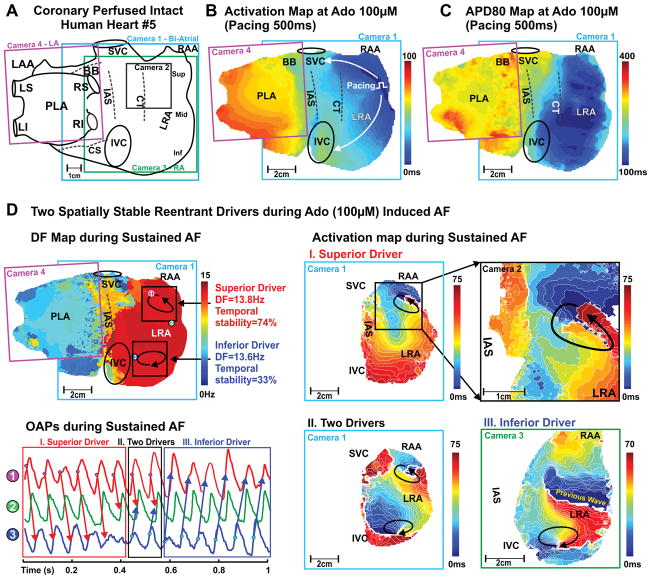
Figure 5. Optical mapping revealed two localized reentrant AF drivers in human Heart #5 (402879).
A, Schematic of the four epicardial cameras’ optical fields of view. Activation map (B) and APD80 map (C) of the intact atria at pacing 500ms during adenosine 100μM. D, Top left: Dominant frequency (DF) map during 100μM adenosine-induced AF. Circled numbers 1–3 indicate the locations where optical action potentials (OAPs) were measured. Bottom left: OAPs from the superior (#1), inferior (#3) AF driver regions and LRA middle non-AF driver region (#2). Right: Activation maps are showing superior and inferior spatially stable AF drivers during adenosine-induced AF. Arrows indicate the location and direction of AF reentrant drivers.

