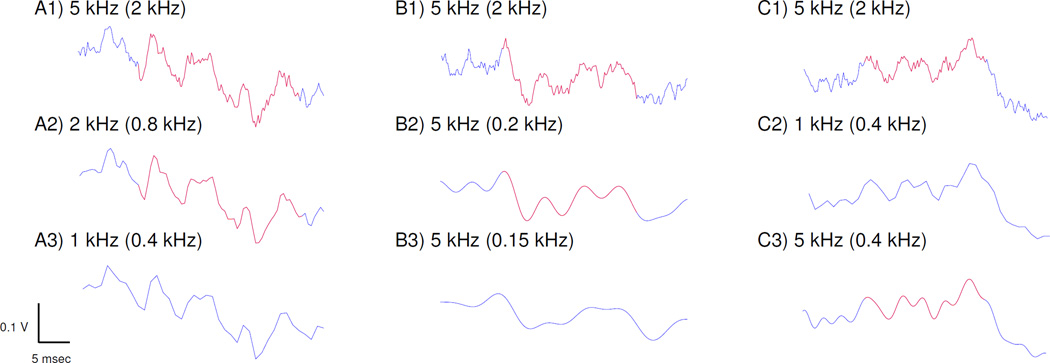
Figure 1. Example HFO detections.
Detected HFOs are shown in red. (A) HFO detected in the original data (A1) is still detected when downsampled to 2 kHz (A2) but not at 1 kHz (A3). Note the low pass filter settings in parentheses, which are created by the Chebyshev filter in the downsampling procedure at 0.4 times the sampling rate. (B) Another original HFO (B1) is still detected when sampling rate remains at 5 kHz and a Butterworth antialiasing filter (AAF) is applied at 200 Hz (B2) but is not detected at 150 Hz (B3). (C) The variability in detection is not simply due to filter setting. In this case, the original HFO (C1) is not detected when downsampled to 1 kHz (C2) but is detected when 5 kHz data are filtered to the same level (C3, 0.4 kHz). Note the clear difference in data quality between C2 and C3 due to sampling rate.

