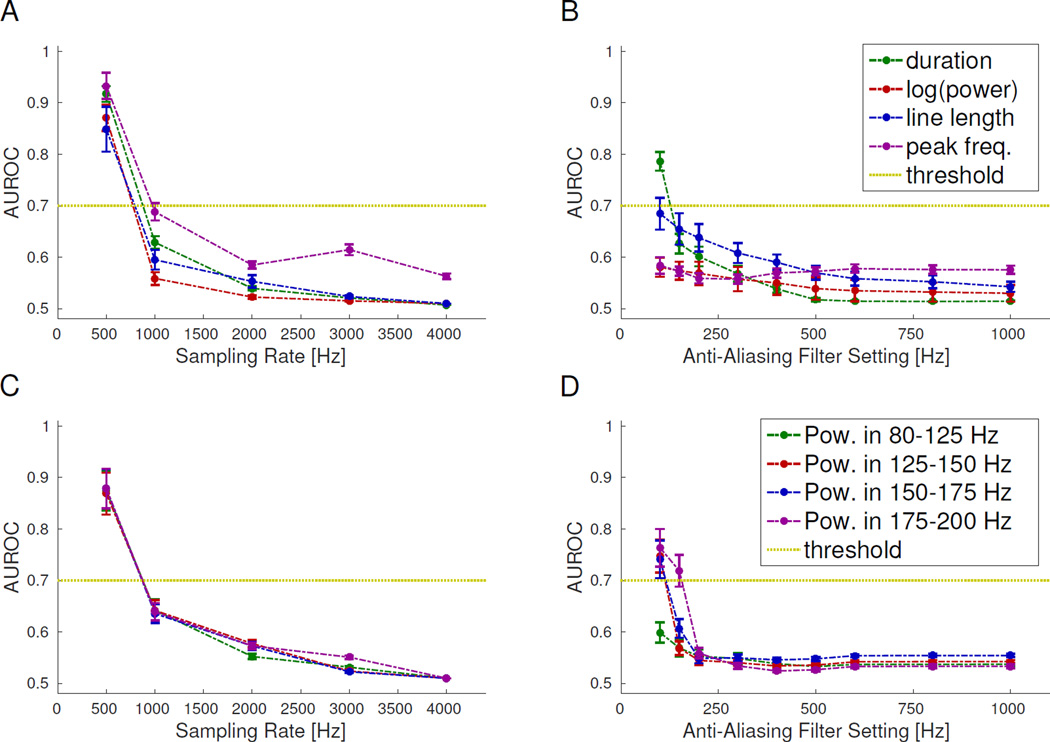
Figure 3. Comparison of HFO feature distributions.
Area under the receiver operator curve (AUROC) between HFO feature distributions for the gold standard versus other sampling rates (A&C) or anti-aliasing filter (AAF) positions (B&D). A low AUROC (<0.7, dashed line) is desirable, meaning the data at lower settings is difficult to distinguish from the gold standard data. All AUROC values are below this threshold for ≥1 kHz sampling rate and ≥200 Hz AAF. Error bars are the standard error on the mean.

