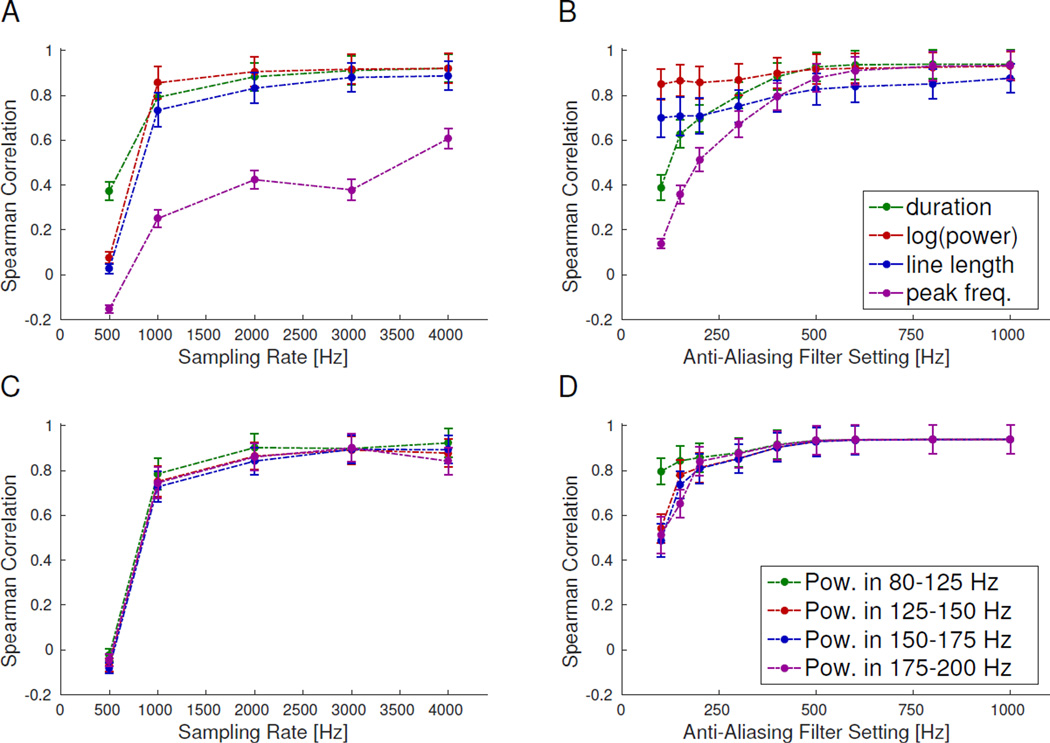
Figure 4. Correlation between individual HFO features.
Spearman correlation of HFO features between gold standard and other sampling rates (A&C) or anti-aliasing filter (AAF) positions (B&D) shows how individual HFOs change with different settings. The correlation is between the same feature being computed on the same HFO, but using the waveform with different sampling rates or AAF positions. All features reach a near asymptotic limit for ≥1 kHz sampling rate and >500 Hz AAF, and most features have similar behavior at different settings. However, peak frequency has considerably worse correlation with lower sampling rates. Error bars are the standard error on the mean.

