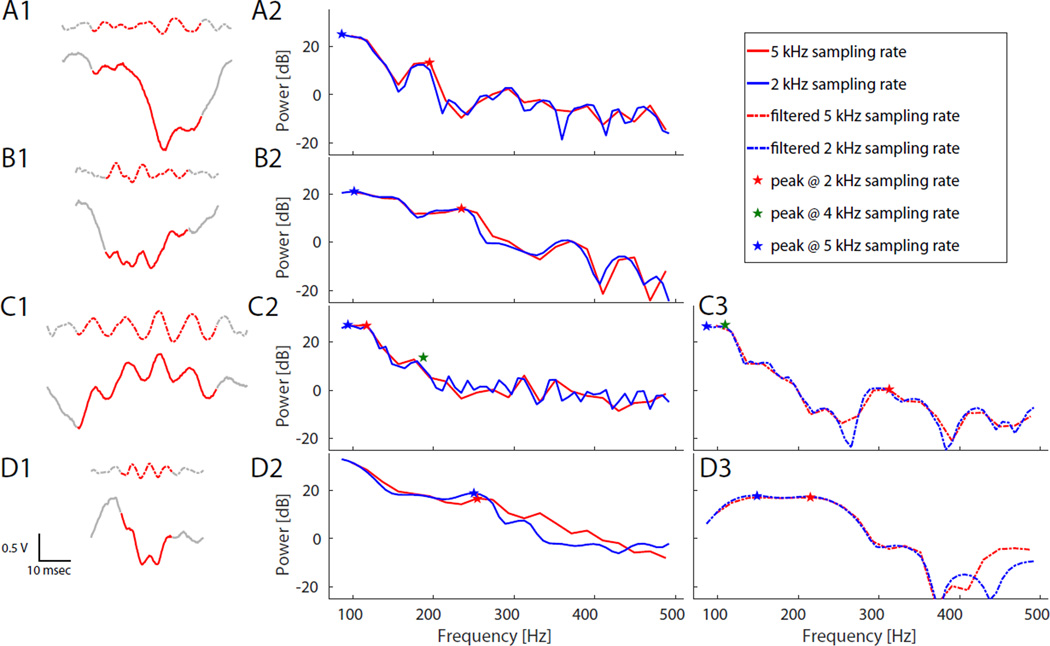
Figure 6. Effect of sampling rate on peak frequency.
Example HFOs and their corresponding Energy Spectral Densities (ESD, calculated with ‘pmtm’ function in Matlab) demonstrate how the calculated peak frequency varies with different sampling rates. Left panel (A1,B1,C1,D1) shows four examples of raw (solid) and 80–500 Hz bandpass-filtered (dashed) data. Middle and right panels shows ESD for raw (solid, (A2,B2,C2,D2)) and filtered (dashed, (C3,D3)) data sampled at 5 kHz and 2 kHz. (A) HFO with 200 Hz oscillation that is difficult to distinguish from downward-sloping high gamma baseline. (B) Broadband oscillation does not stand out well from background, and has ambiguous peak. (C) Poor resolution of HFOs often produces noisy ESD background. Location of peak frequency detected with data sampled at 4 kHz is also shown in this panel (green star; ESD data not shown). On panels A, B, and D, the 4 kHz peak was identical to 2 kHz (not shown) (C3&D3) Bandpass-filtering the data does not mitigate the uncertainty, in these cases potentially changing the detected peak frequency from >250 Hz to < 200 Hz, or vice versa. (D) HFOs can appear as wide band events.

