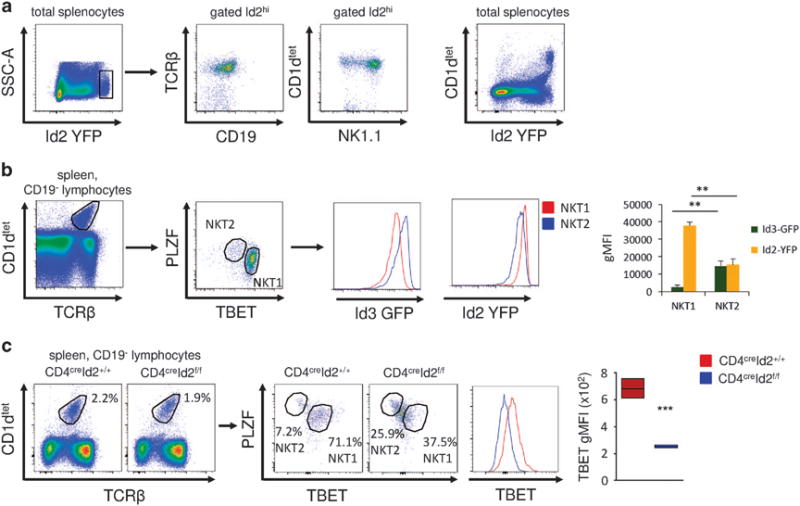
Figure 1.

Id2 is required for NKT1 cells. (a) Representative fluorescence-activated cell sorting (FACS) plots of total splenocytes and gated Id2hi cells. (b) Representative FACS plots showing the gating strategy for NKT1 and NKT2 cells. Histograms and bar graphs show the geometric mean fluorescent intensity (gMFI) of Id2YFP and Id3GFP in NKT1 and NKT2 cells. Mean ± s.d. of three mice, representative of three independent experiments. (c) Splenic iNKT cells from untreated CD4creId2+/+ and CD4creId2f/f mice were analyzed for expression of the indicated transcription factors. Representative FACS plots and histogram of splenic iNKT cells gated as in (b). Graph of iNKT cells from three mice, representative of two experiments. Statistical significance was evaluated with unpaired Student’s t-test, where **P>0.01 and ***P>0.001.
