Figure 4.

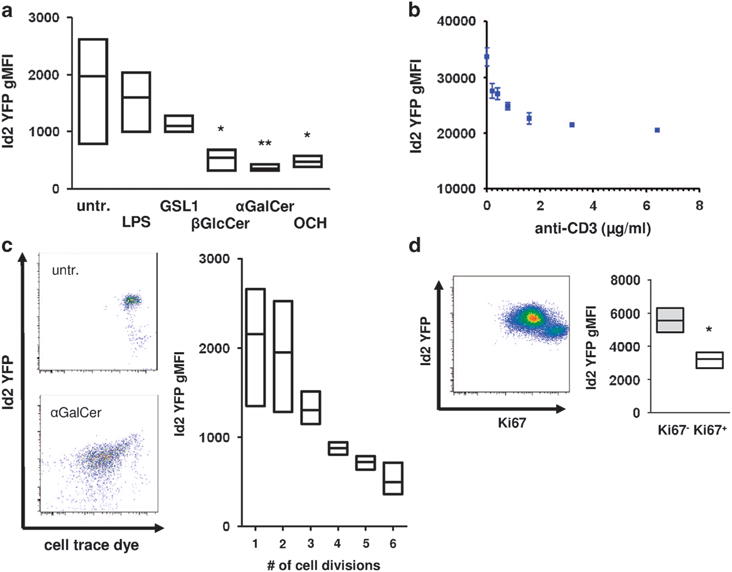
TCR signaling mediates downregulation of Id2. (a) Total splenocytes were stimulated with the indicated substances for 3 days in vitro. iNKT cells were gated as in Figure 1b and were analyzed for Id2 YFP expression. Histogram and bar graph indicating Id2 YFP geometric mean fluorescent intensity (gMFI) of iNKT cells representative of two independent experiments with three individual mice each. (b) Sorted splenic iNKT cells were stimulated with the indicated amount of plate-bound anti-CD3 and 1 μg ml−1 of anti-CD28 for 3 days in vitro. Representative data of two independent experiments with three individual mice each. (c) Total splenocytes were stimulated with 100 ng ml−1 αGalCer for 3 days in vitro. Id2 YFP expression and cell trace dye were analyzed. Representative fluorescence-activated cell sorting (FACS) plots and bar graph from two independent experiments with three individual mice each. (d) Mice were treated with 1 μg αGalCer intraperitoneally and Id2 YFP and Ki-67 expression were analyzed in splenic iNKT cells on day 3 after injection. Representative FACS plot and bar graph from three individual mice. Bar graphs indicate minimum to maximum and mean values of gMFI. Statistical significance was evaluated using unpaired Student’s t-test and one-way analysis of variance with Bonferoni post hoc test. *P>0.05 and **P>0.01.
