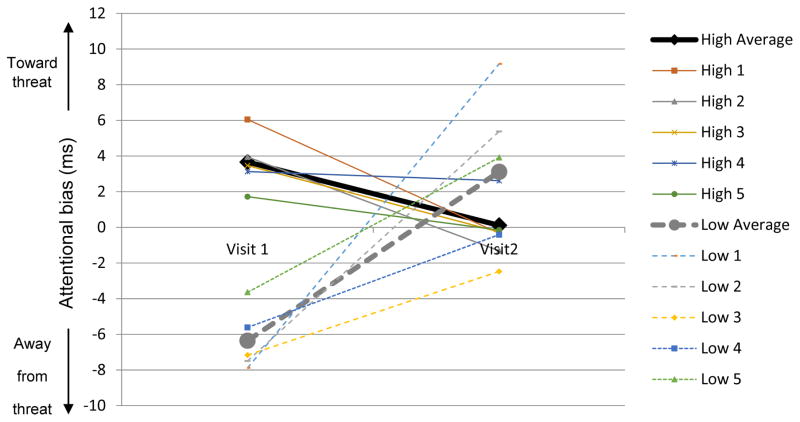
Figure 1.
Demonstration of what would occur if participants in our Study 1 were selected based on extreme bias scores at Visit 1. Shown are the participants with the five highest and five lowest global attentional bias scores in Study 1 of the supplemental material, based on Visit 1, and their global attention bias scores at both visits. Thin lines represent individual cases; thick lines represent the average within each group. Arguably due to low stability of the global attentional bias score, participants show a regression to the mean overall (all high scores and all low scores trend toward zero, with some flipping sign); Calamaras et al. (2012) showed the same pattern and speculated it might be due to treatment, but here participants received no treatment.

