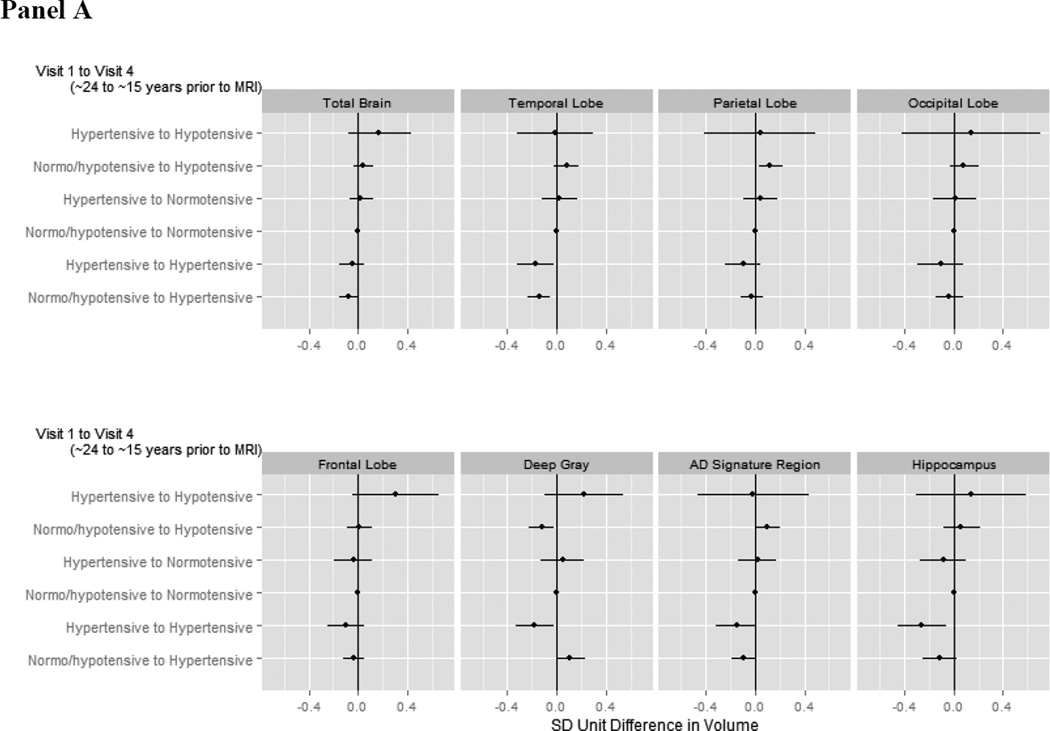
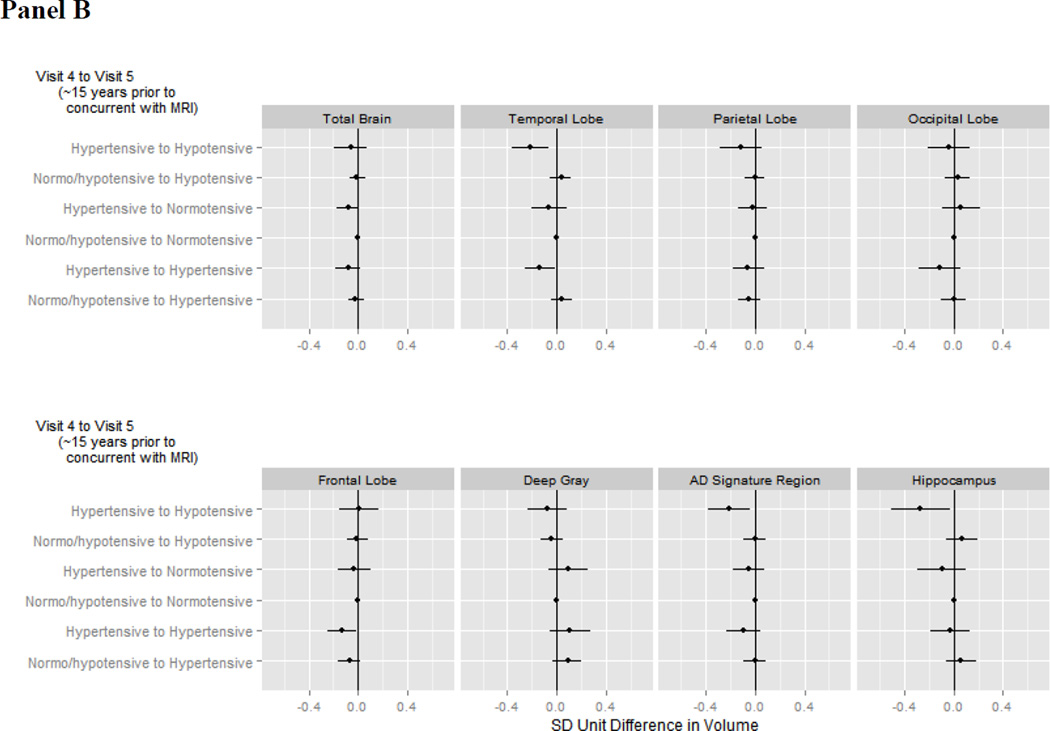
Figure 3. Adjusted average difference in brain volumes in late life for a given pattern of blood pressure.
Panel A illustrates associations with patterns from Visit 1 (~24 years prior to neuroimaging) to Visit 4 (~15 years prior to neuroimaging) while panel B illustrates associations with patterns from Visit 4 (~15 years prior to neuroimaging) to Visit 5 (concurrent with neuroimaging). The reference category is those with earlier normo-or hypotension and later normotension. Analyses were weighted to account for sampling and adjusted for gender, race-center, education, age, estimated intracranial volume, BMI, diabetes, high cholesterol, smoking status, antihypertensive medication use, and gender*estimated intracranial volume.


