
Fig. 3.
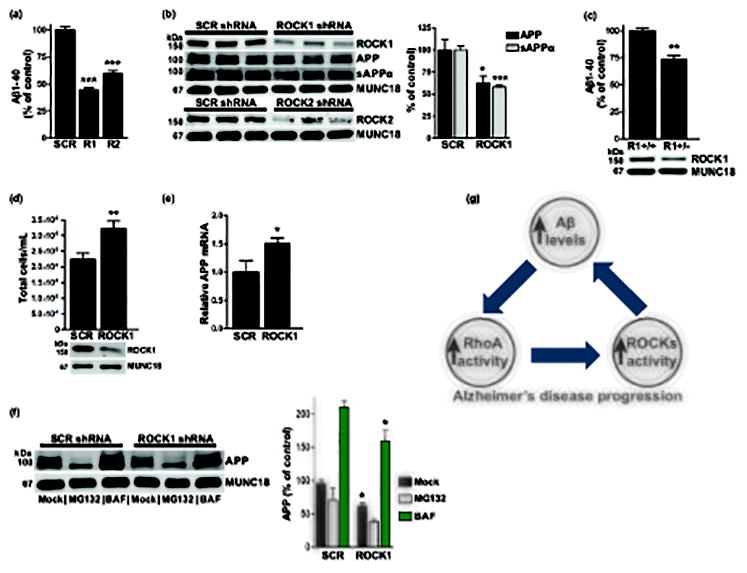
ROCK1 depletion reduces Aβ levels. (b – d, f) Representative immunoblots shown. (a) ROCK1 shRNA (R1) or ROCK2 shRNA (R2) reduced Aβ40 (***p<0.0001) compared to scramble (SCR) controls. N=4 replicates per condition. (b) Densitometry analysis revealed that APP (*p=0.0246) and sAPPα (***p=0.0008) were reduced in ROCK1-depleted neurons. N=5 replicates per condition. (c) Aβ40 was reduced (**p=0.0037) in ROCK1+/− mice (R1+/−) compared to ROCK1+/+ littermates (R1+/+). N=3 replicates per condition. (d) Cell numbers were increased (**p=0.0085) in ROCK1-depleted wells compared to SCR. N=7 replicates per condition. (e) ROCK1 knockdown increased relative APP mRNA level (*p=0.0475). N=6 replicates per condition. (f) APP is reduced in ROCK1-depleted neurons (*p=0.0158), and APP accumulates in bafilomycin (BAF) treated neurons (*p=0.0282). N=3 replicates per condition. (g) Proposed model of the interrelationship between Aβ and RhoA/ROCK activity in AD progression. All data are expressed as the percentage of the control mean ± SEM.