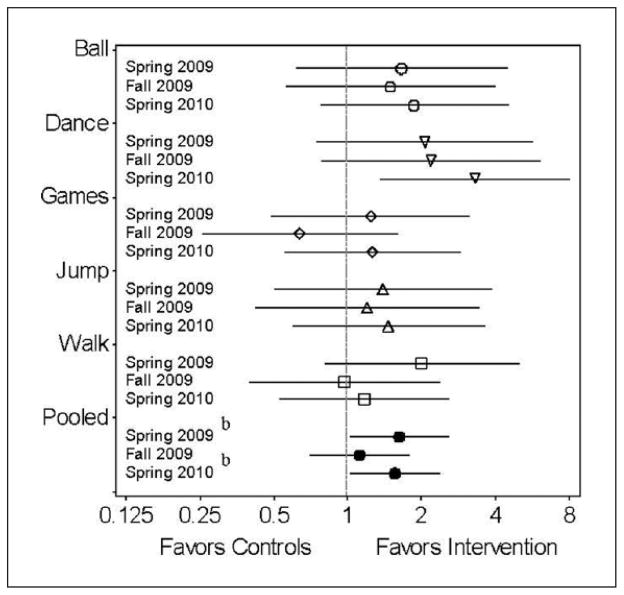
FIGURE 2. Specific activities and Pooled activity relative Changesa (95% Confidence Intervals; Log 2 Scale), according to assessment Time, in the Control Compared with the CHILE Intervention group.
NOTE: CHILE = Child Health Initiative for Lifelong Eating and Exercise.
aRelative changes values were adjusted for Head Start center race/ ethnicity, prestudy body mass index strata, parent education level, sampling period, and drop out to attend another prekindergarten program. bSignificant difference (p < .05)

