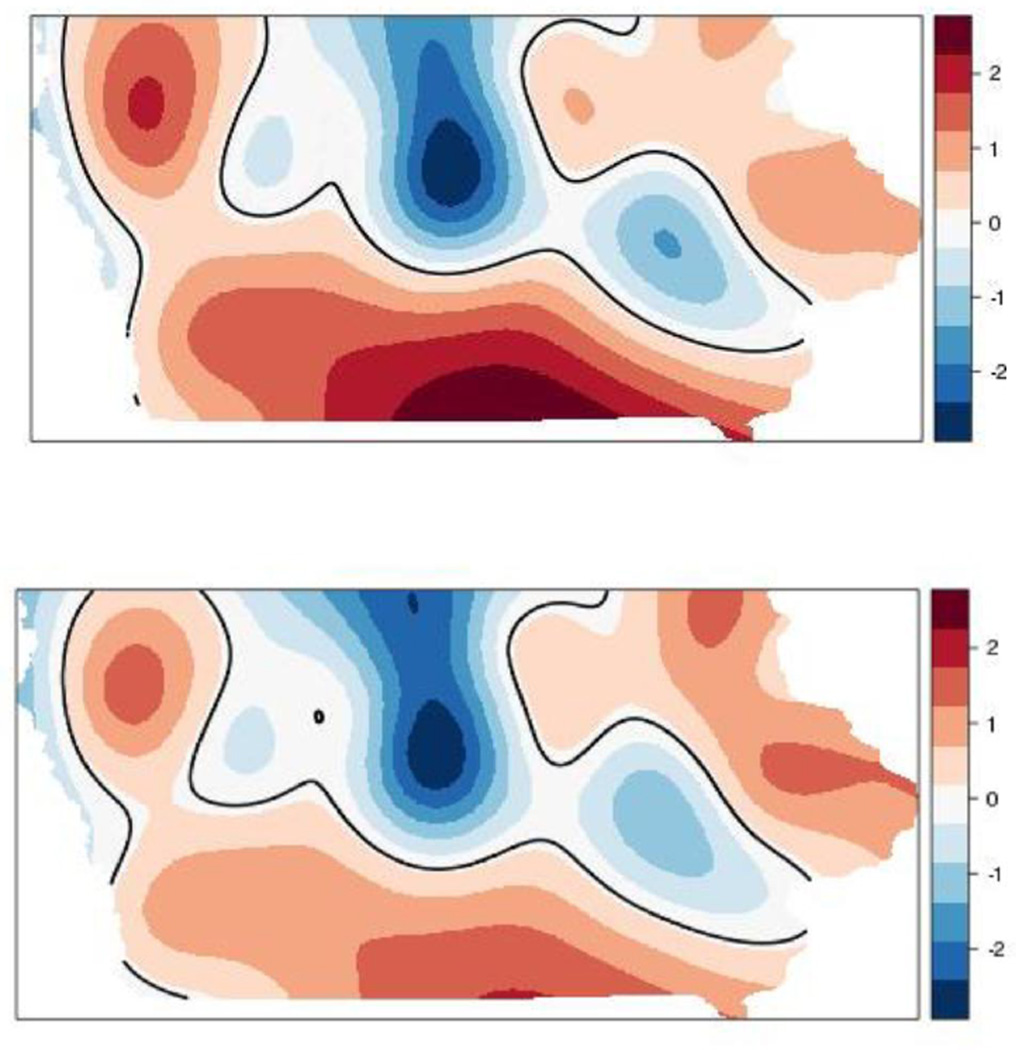
Figure 4.
Crude spatial log-odds of high-nitrate (> 5 mg/L) well status (top panel) and adjusted spatial log-odds accounting for well depth, total animal units within 10 km, total AFOs within 2 km, and open AFOs within 5 km (bottom panel). The black lines indicate statistically significant areas of risk of being a high-nitrate well.

