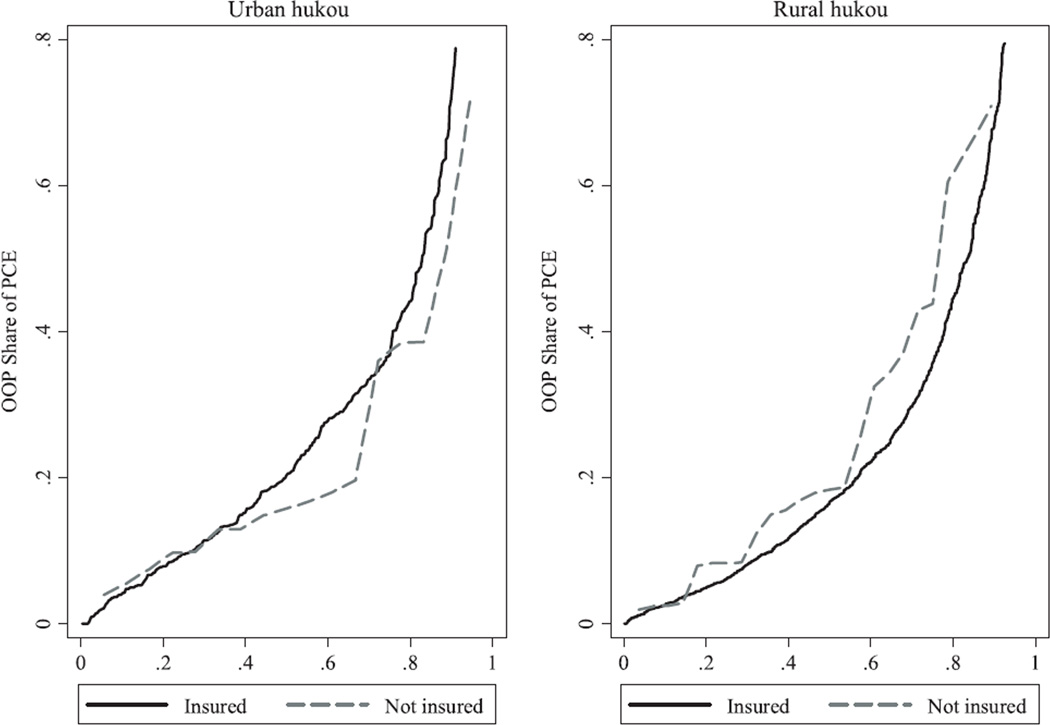
Figure 2.
Cumulative percentage of share of out-of-pocket (OOP) expenditure of per capita expenditure (PCE): inpatient service
Notes: Weighted using individual sampling weights with household and individual response adjusted. Observations with share of OOP expenditure of PCE larger then 1 are trimmed.

