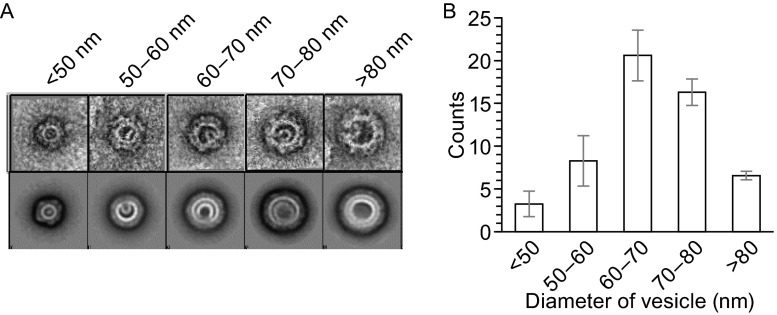
Figure 3.
Diameter distribution of reconstituted COPI-coated vesicles. (A) The raw images of vesicles (first row) and the corresponding 2D class averages of vesicles with the same diameter (second row). The diameters are indicated on the top. (B) A statistical histogram of the vesicle number vs. different diameters. All error bars represent standard deviation (s.d.) from three independent vesicle reconstitution experiments. For each experiment, the number (N) of micrographs is 90

