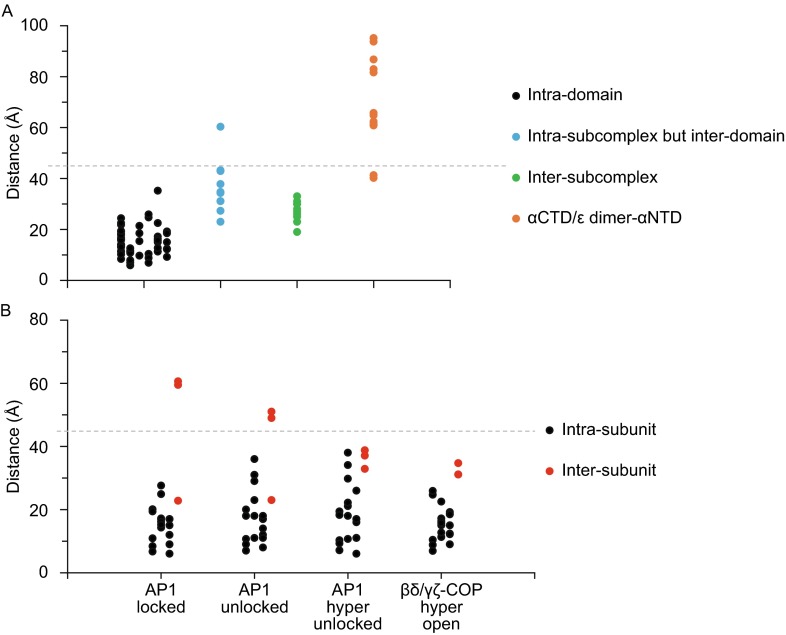
Figure 5.
Mapping CXMS cross-linked residue pairs onto structural models. (A) The distances between Cα–Cα atoms of cross-linked residues pairs were measured based on the membrane-bound coatomer model (PDB ID: 5A1U), classified and plotted. (B) The distances between Cα–Cα atoms of cross-linked residues pairs within the adaptor F-subcomplex were measured based on four models as indicated, classified into intra-subunit (black) and inter-subunit (red) ones and plotted. The cut-off distance of 45 Å is represented by the dashed line

