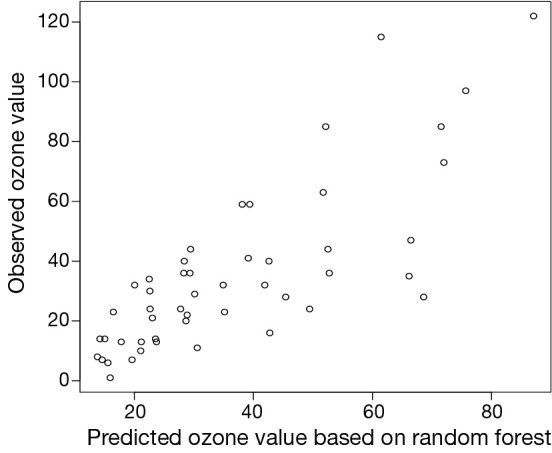
Figure 5.

Scatter plot showing the observed ozone values against predicted values by random forests model. This time the predicted value is not restricted to five levels. Instead, they are evenly distributed across the ozone range, which is more likely to occur in the real world.
