
Fig. 1.
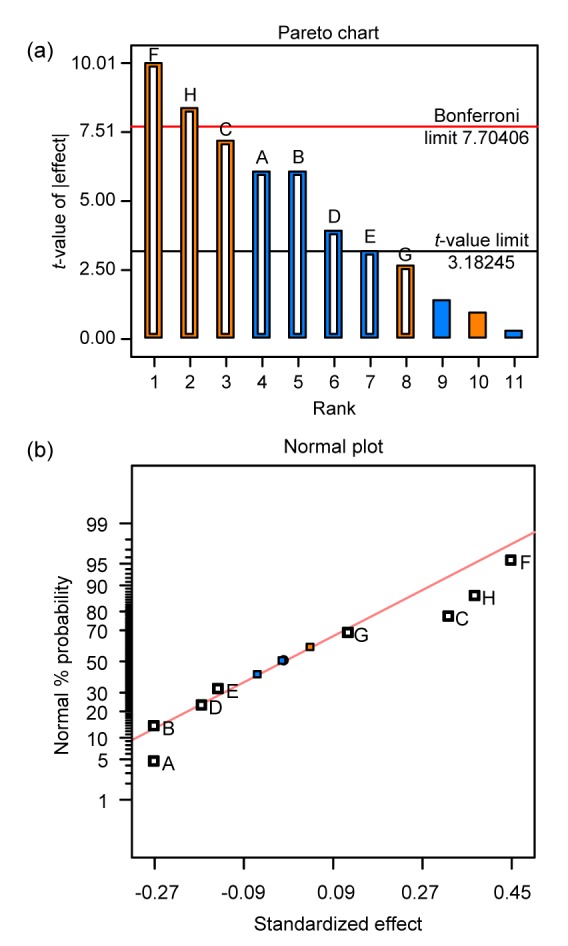
Pareto chart (a) and normal plot graph (b) identifying the screening factors
Hollow shapes represent the 8 factors of PB test, and among them, orange (F, H, C, G) denotes positive effects; blue (A, B, D, E) denotes negative effects; solid shapes represent 3 blank tests (Note: for interpretation of the references to color in this figure legend, the reader is referred to the web version of this article)