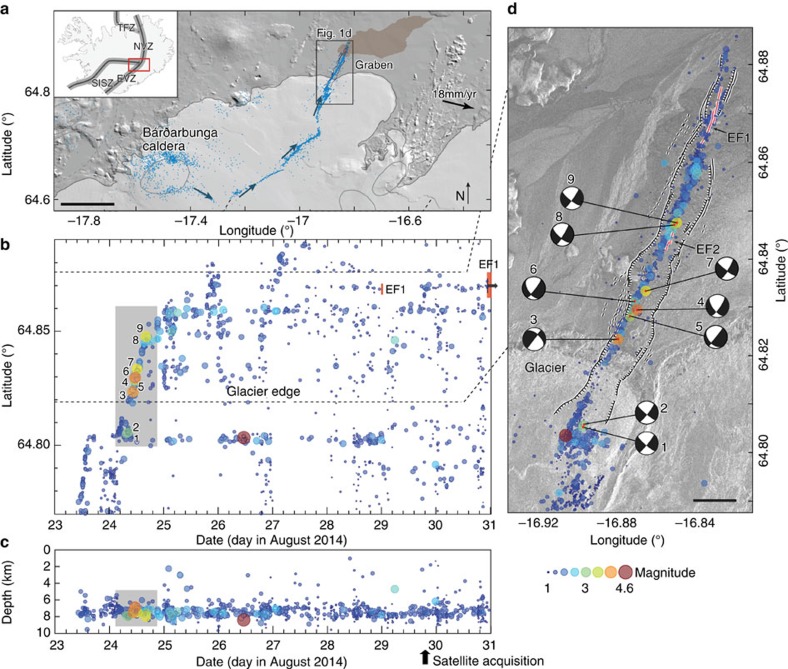
Figure 1. Rifting event seismicity and graben location.
(a) Map of the study area in central Iceland (see inset) showing the seismic swarm pathway (blue dots and arrows) from Bárðarbunga caldera to the eruption site north of the glacier. The brown shaded area shows the lava flow coverage as in October 2014. EVZ, East Volcanic Zone; NVZ, North Volcanic Zone; SISZ, South Iceland Seismic Zone; TFZ, Tjörnes Fracture Zone. Black scale bar, 10 km. (b) Earthquake latitude and (c) earthquake depths as a function of time referenced to sea level for the northernmost part of the earthquake sequence7. The colour and size of each circle is according to earthquake magnitude. The red vertical bars mark the timing of the principal eruptive fissure activity EF1. The grey rectangles mark the period of the most intensive earthquake activity with numbered events further described in d and Supplementary Fig. 1. The first satellite image acquisition was on 29 August at 19:37:41 GMT. (d) SAR amplitude-image map of the graben showing earthquake epicentres, fault plane solutions for Mw>3.5 events and eruptive fissures (EF1 and EF2). Black scale bar, 1 km.

