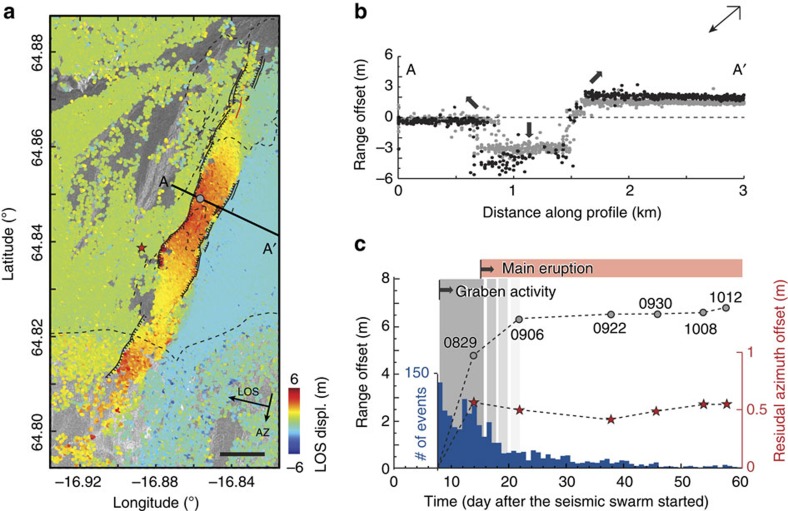
Figure 3. Graben deformation.
(a) SAR-image (COSMO-SkyMed; descending orbit) range offsets of the graben area (29 August 2014) showing the line-of-sight (LOS; black arrow) ground displacements. Red indicates ground displacement down and away from the radar. Black lines mark the graben faults. Horizontal black scale bar, 1 km. (b) LOS displacement along profile A–A′ (location shown in a) for 29 August (grey dots) and 6 September (black dots) 2014. Thick arrows indicate subsidence and uplift directions; the down-looking arrow to the top right shows the satellite's LOS direction. (c) Displacement time series of the graben (location marked in a with a circle) for six different dates in comparison to the number of seismic events (histogram). The red stars are the azimuth offset time series after model removal (Fig. 4b), showing that the left-lateral shear occurred before 29 August. The progressively lighter grey shading with time illustrates the decaying graben deformation.

