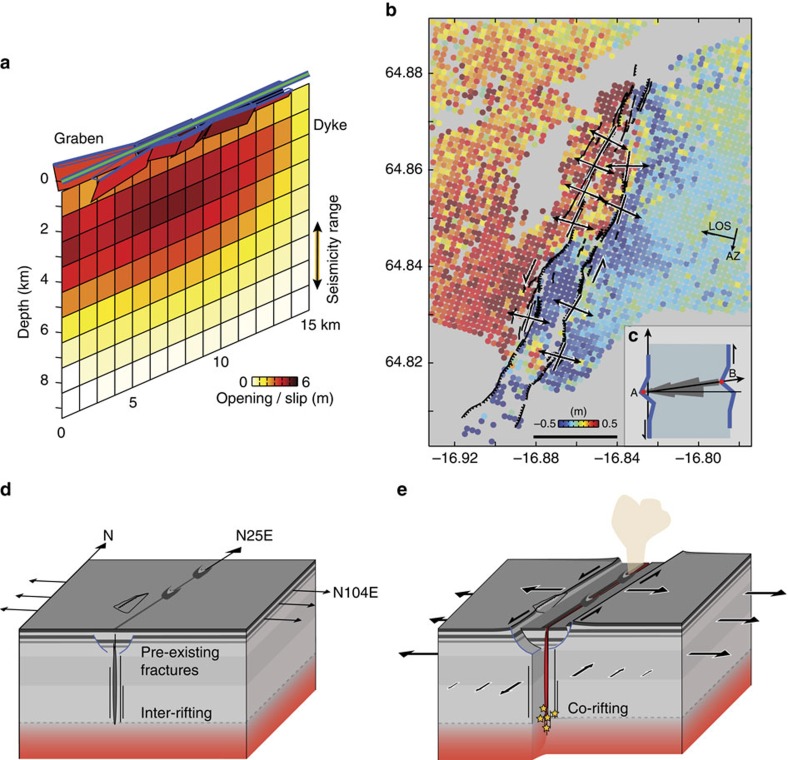
Figure 4. Dyke model and left-lateral shear opening.
(a) Model of the dyke opening and graben faulting estimated from the radar-image offset data (Fig. 3a and Supplementary Fig. 3). Green line shows the surface projection of the dyke. (b) SAR-image residual azimuth offsets (6 September 2014) after removal of the dyke opening contribution (see modelling details in Supplementary Fig. 3), showing about 1 m of left-lateral shear across the graben. The black arrows show opening orientations across graben-bounding fractures measured in the field. Black horizontal bar scale at the inset bottom, 2 km. (c) Rose diagram (structural data set with n=108) showing the left-lateral shear opening; thick blue lines represent a schematic of an open fracture with matching asperities on the fracture walls (A and B showing the asperity match). (d) Schematic cross-section of the inter-rifting period subject to steady extension deficit accumulation oriented at N104° E. The pre-existing graben, which is buried below older lava flows, has an orientation of N25°E. The grey dashed line represents the brittle–ductile boundary. (e) Schematic cross-section of the 2014–2015 rifting event that shows the dyke intrusion causing near-field left-lateral shear, extension and graben reactivation. Yellow stars represent the earthquake locations at the lower edge of the dyke path.

