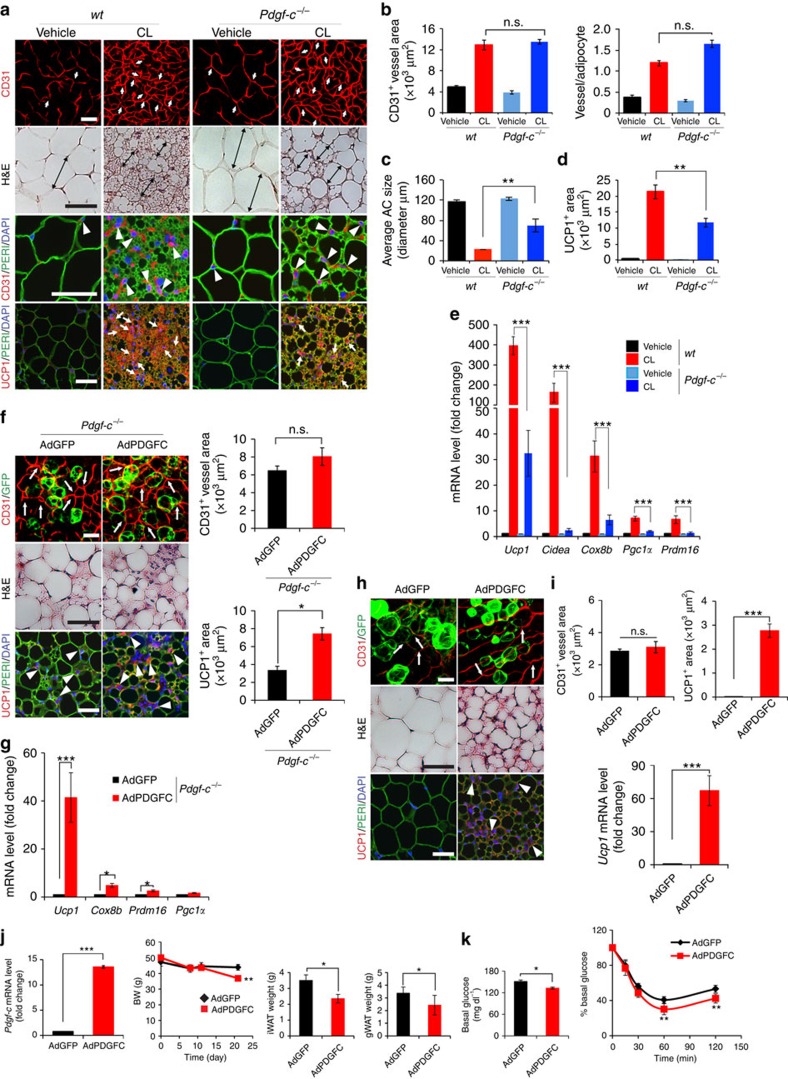
Figure 6. Impaired CL-induced beige transition in Pdgf-c−/− mice and gain-of-function by delivery of AdPDGFC.
(a) Histological images of microvessels (CD31+ red, white arrows and arrow heads), adipocyte morphology (H&E, double arrowed bars, perilipin+green), and UCP1 (UCP1+ red, white arrows). n=5 mice for each wt and Pdgf-c−/−group. (b) Quantification of microvessel density in vehicle- and CL-treated gWAT in wt and Pdgf-c−/− mice. (n=10 random fields; n=5 mice for each group). (c) Quantification of average adipocyte size (>30 adipocytes/field; n=10 random fields; n=5 mice for each group). (d) Quantification of UCP1-positive signals (n=10 random fields; n=5 mice for each group). (e) qPCR quantification of browning markers' expression levels in vehicle- and CL-treated total gWAT samples in wt and Pdgf-c−/− mice. (n=10 samples for each group). (f) Delivery of AdPDGFC to gWAT of CL-injected Pdgf-c−/− mice. Arrows point to CD31+ microvessels and arrowheads point to UCP1-positive signals. Quantification of CD31+ and UCP1+ signals (n=10 randomized fields). n=8 mice for each wt and Pdgf-c−/− group. (g) qPCR quantification of browning markers' expression levels in AdGFP- and AdPDGFC-injected gWAT of CL-treated Pdgf-c−/−mice (n=12 samples for each group). (h) Delivery of AdPDGFC or AdGFP to gWAT of NOD-SCID mice. Arrows point to CD31+ microvessels and arrowheads point to UCP1-positive signals. (i) Quantification of CD31+ and UCP1+ signals (n=10 randomized fields; n=8 mice for each group). (j) Pdgf-c expression level in iWAT by delivery of AdPDGFC, body weight curve and adipose depot weights of HFD-induced obese mice receiving AdGFP and AdPDGFC treatment (n=6 animals for each group). (k) Insulin tolerance of AdGFP- and AdPDGFC-treated HFD-induced obese mice (n=10 animals for each group). The Mann–Whitney test. All scale bars, 50 μm. *P<0.05; **P<0.01; ***P<0.001 by two-sided unpaired t-test. Data presented as mean±s.e.m. n.s., not significant.

