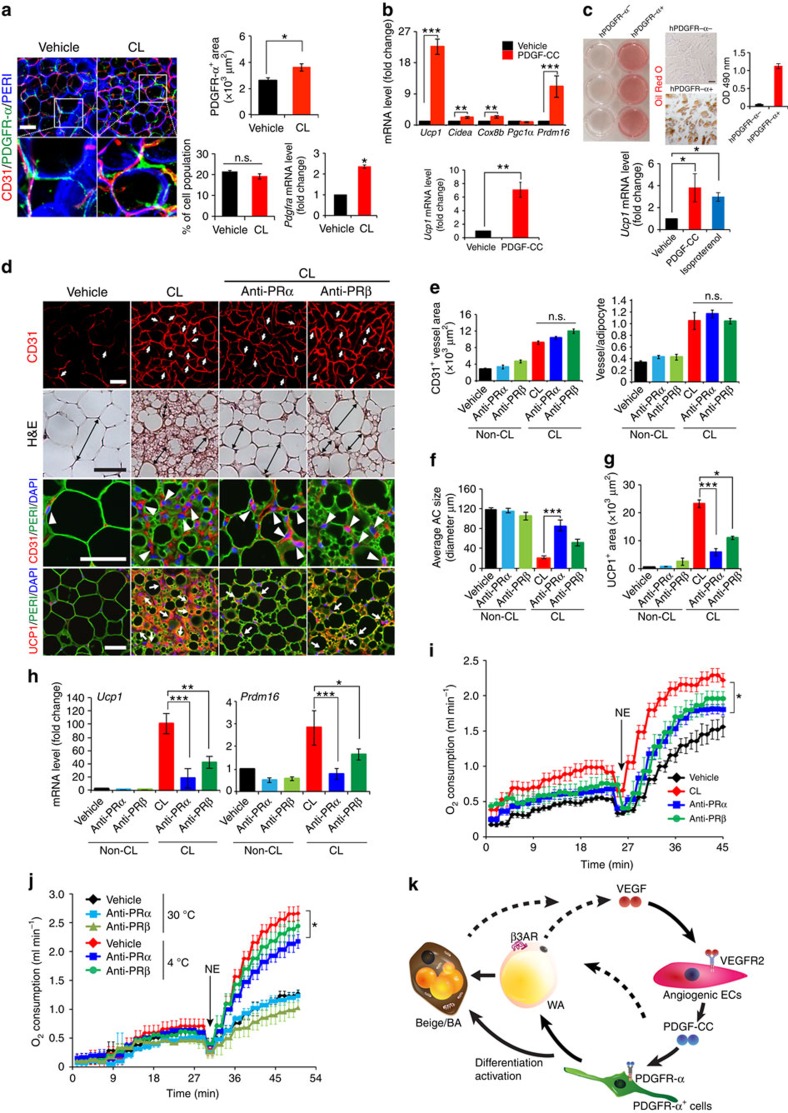
Figure 7. PDGF-CC promotes adipose progenitor cell differentiation toward a beige phenotype and PDGFR-α blockade CL-induced beige transition.
(a) Localization of PDGFR-α+ cells, the quantification, FACS analysis, and Pdgfra mRNA expression in vehicle- and CL-treated gWAT of wt mice (n=4 for staining and n=6 for FACS; n=10 for quantification; n=6 for qPCR). (b) qPCR analysis of browning markers' expression levels by PDGF-CC stimulation in differentiated gWAT-PDGFR-α+ cell populations. (c) Oil Red O staining and qPCR analysis (n=9 samples for each group) in human differentiated PDGFR-α− and PDGFR-α+ cells. (d) Histological images of microvessels (CD31+ red, white arrows and arrow heads), adipocyte morphology (H&E, double arrowed bars; perilipin+green), and UCP1 (UCP1+ red, white arrows). (e) Quantification of microvessel density in vehicle- and CL-treated gWAT in wt mice that received PRα and PRβ blockade treatment (n=10 random fields; n=8 mice for each group). (f) Quantification of average gWAT adipocyte size (>30 adipocytes/field; n=10 random fields; n=8 mice for each group). (g) Quantification of UCP1-positive signals (n=10 random fields; n=8 mice for each group). (h) qPCR quantification of browning markers' expression levels in gWAT from wt mice that received various treatments. (i) Norepinephrine-stimulated non-shivering thermogenesis in PRα and PRβ blockade- and vehicle-treated mice that received CL or buffer (n=5 mice for each group). NE, norepinephrine. (j) Norepinephrine-stimulated non-shivering thermogenesis in PRα and PRβ blockade- and vehicle-treated mice that had been exposed to 4 or 30 °C (n=5 mice for each group). (k) Schematic diagram of paracrine regulatory mechanisms by which the VEGF-VEGFR2 and PDGF-CC-PDGFR-α signalling systems cohesively and reciprocally control adipose endothelial cell-adipocyte crosstalk, leading to the transition of beige cell differentiation from PDGFR-α+ cells in WAT. AR, adrenoceptor; BA, brown adipocyte; WA, white adipocyte. All scale bars, 50 μm. *P<0.05; **P<0.01; ***P<0.001 by two-sided unpaired t-test. Data presented as mean±s.e.m. n.s., not significant.

