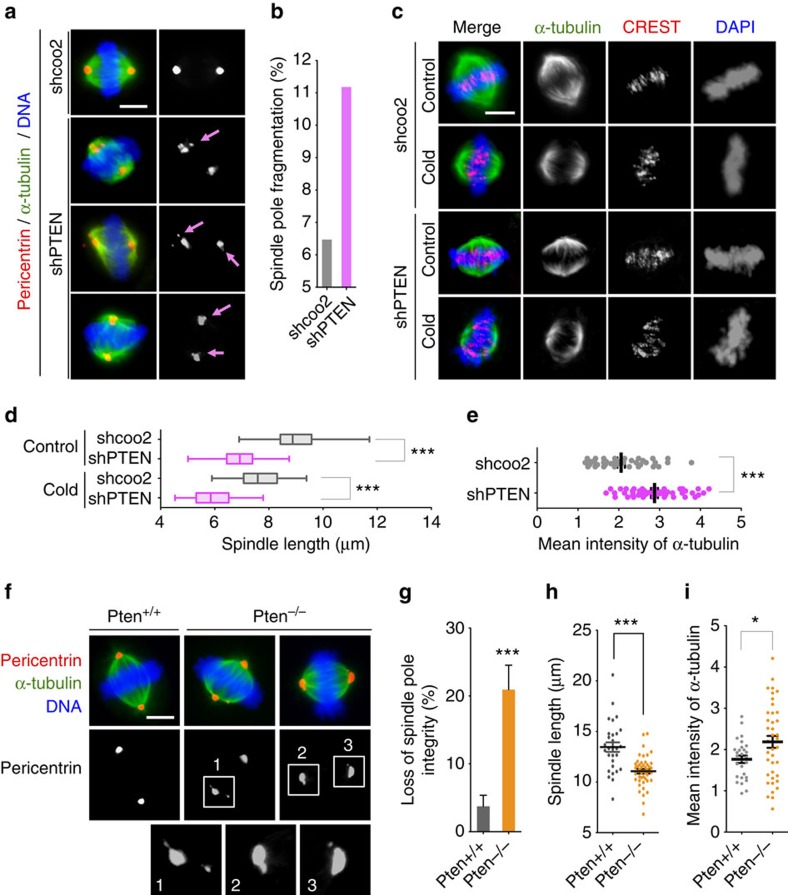
Figure 2. PTEN depletion impairs mitotic spindle geometry.
(a) Spindle pole fragmentation in PTEN knockdown cells. PTEN knockdown and control cells were immunofluorescent stained for mitotic spindle (α-tubulin, green) and spindle poles (pericentrin, red). Arrows point to fragmented spindle poles. Scale bar, 5 μm. (b) Summary of the frequency of mitotic cells exhibiting spindle pole fragmentation in cells with and without shPTEN. (c) Shortening of mitotic spindles by PTEN knockdown. HeLa cells with and without shPTEN were left at 37 °C or placed at 4 °C for 10 min before immunofluorescence of microtubules (α-tubulin, green) and kinetochores (CREST, red) with DAPI counterstaining of chromosomes. Scale bar, 5 μm. (d) Box-and-Whisker plot showing the distribution of spindle lengths in PTEN knockdown cells and control cells with and without cold treatment. Data (n>50 in each condition) were analysed by one-way analysis of variance (ANOVA) followed by Bonferroni's multiple comparisons. ***P<0.001. (e) Summary of α-tubulin mean intensity within the spindle area in cells with and without PTEN knockdown. (f) Immunofluorescence of mitotic spindles (α-tubulin, green) and spindle poles (pericentrin, red) in Pten+/+ and Pten−/− MEFs. Scale bar, 5 μm. (g–i) The frequency of spindle pole fragmentation (g), spindle pole distance (h) and α-tubulin mean intensity (i) is compared in Pten+/+ and Pten−/− cells. Data are presented as means±s.e.m. and two-tailed t-test was used for data analysis. ***P<0.001.

