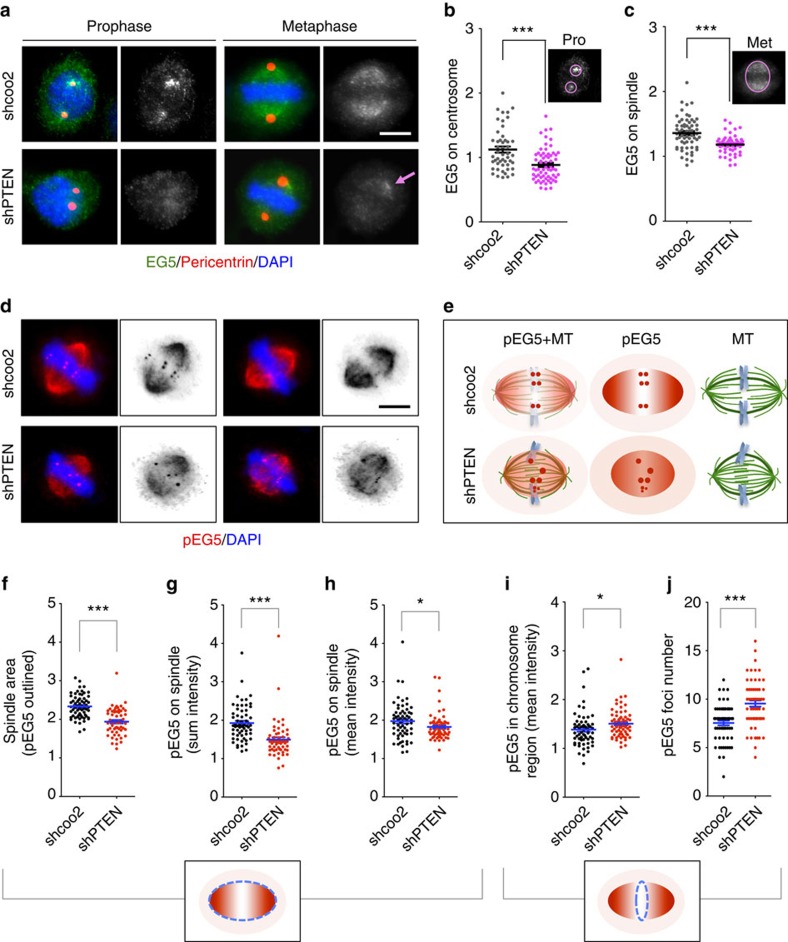
Figure 5. PTEN depletion causes aberrant distribution of EG5 on the mitotic spindle apparatus.
(a) Co-immunofluorescence of EG5 (green) and pericentrin (red) showing reduced recruitment of EG5 to centrosomes (prophase) and spindles (metaphase) in PTEN knockdown cells. Gray scale of EG5 staining is also shown. Arrow points to aberrant EG5 enrichment in a region near the spindle pole. Scale bar, 5 μm. (b,c) Mean intensities of EG5 in the prophase centrosome region (b) or the metaphase spindle region (c) were measured as indicated in the upper-right corner of the scatter plots. (d,e) Immunofluorescence of phosphorylated form of EG5 (red). Scale bar, 5 μm. Note that PTEN knockdown cells lose a signal gradient along the spindle axis but exhibit an aberrant enrichment of phospho-EG5 in the spindle midzone, as depicted in the schemas (e). (f–h) Scatter dot plots summarizing the spindle area outlined by phospho-EG5 (f), sum intensity and mean intensity of phospho-EG5 in the spindle area (g,h). (i,j) Summary of phospho-EG5 mean intensity and foci number in the spindle midzone. Data are presented as means±s.e.m. and analysed by two-tailed t-test. *P<0.05; ***P<0.001.

