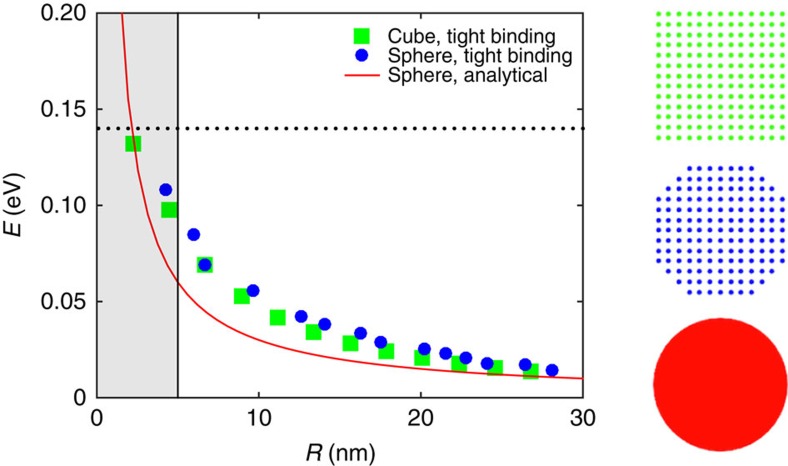
Figure 2. Surface states obtained with different methods.
Energy of the first surface state above the Dirac point calculated with a tight-binding model for cubic (green squares) and spherical (blue circles) particles compared with analytical results (red curve). Models are illustrated on the side. Good agreement between the energies of spherical and cubic (edge size  ) particles is due to topological nature of the surface states. The horizontal dotted line denotes the bulk band gap and the shaded region is where the model breaks down. Subsequent calculations use R>10 nm where model shows good validity.

