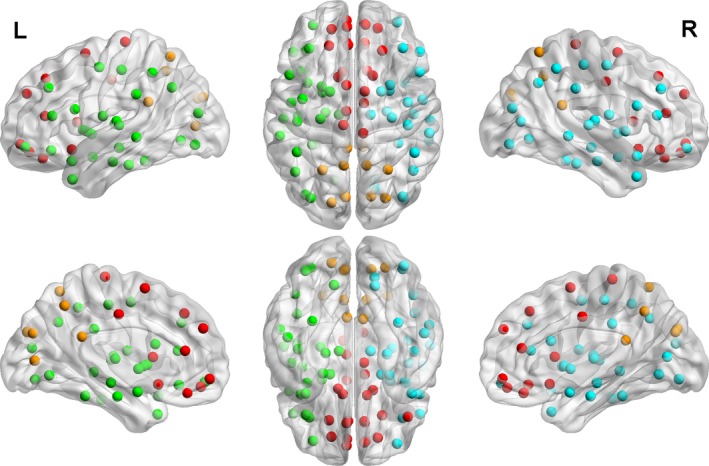
Figure 2.

Subnetworks found from graph analysis. Performing graph analysis (modularity) on the participant‐wise averaged adjacency matrices (thresholded at cost = 0.15) yielded four subnetworks: left and right intrahemispheric (green and blue, respectively); and frontal and posterior interhemispheric (red and brown, respectively).
