
Fig. 2.
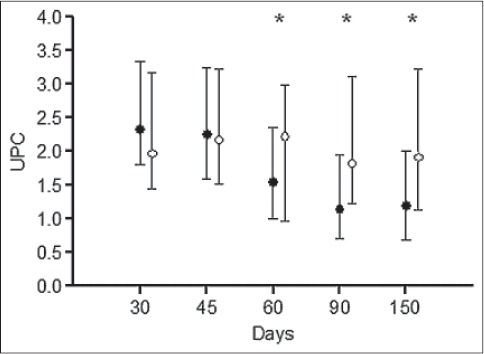
UPC ratio in dogs receiving enalapril and renal diet (group A, black dots) or benazepril and renal diet (group B, white dots) at randomization (day 30) and follow-up. Median values and interquartile ranges are shown. Significant differences between group A and B are depicted with asterisks (p<0.05).