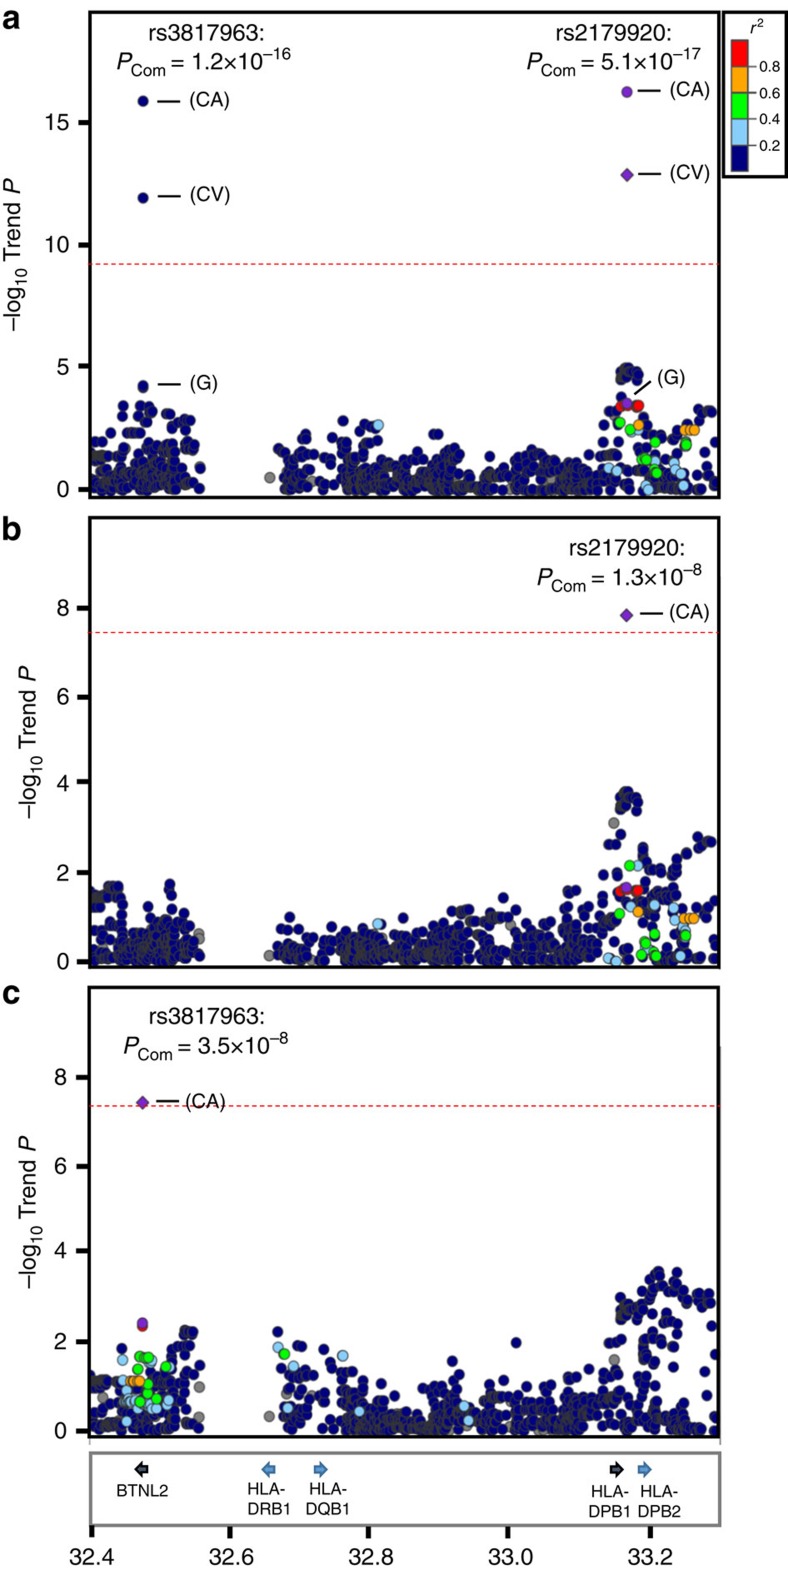
Figure 1. Regional plots of variations in the HLA class II region.
Plots show results of association studies of (a) nominal analysis, (b) conditioned analysis on rs3817963 and (c) conditioned analysis on rs2179920. Red line shows the level of genome-wide significance for association (PTrend<5 × 10⁻⁸). Genes within the region of interest are annotated and are indicated by arrows. The physical positions of the variants in the HLA class II region are shown at the bottom. Circles represent the location and –log10 (PTrend values) of each variant. The –log10PTrend values of the marker SNPs are shown for the GWAS (G), the combined validation study (CV) and the total combined study (CA).

