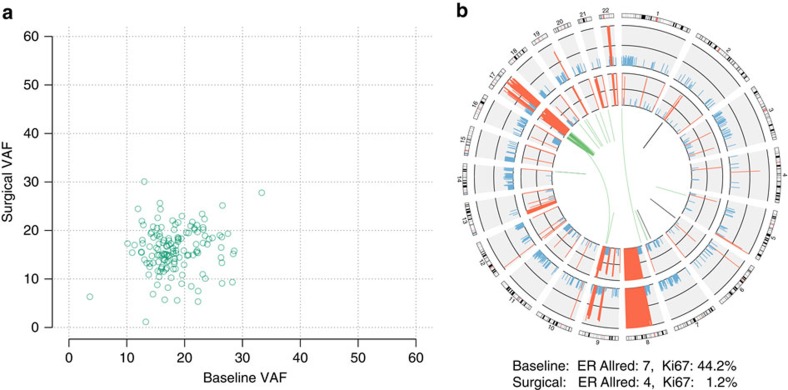
Figure 2. Simple and stable clonal structure in BRC14.
(a) Clonality plot comparing the variant allele fraction of SNVs in the baseline and surgical samples. (b) Gene fusions and copy number alterations. Outer ring: CN alterations in the baseline sample (amplifications in red, deletions in blue). Inner ring: CN alterations in the surgical sample. Centre: gene fusion events that were specific to the baseline (green) or surgical sample (brown).

