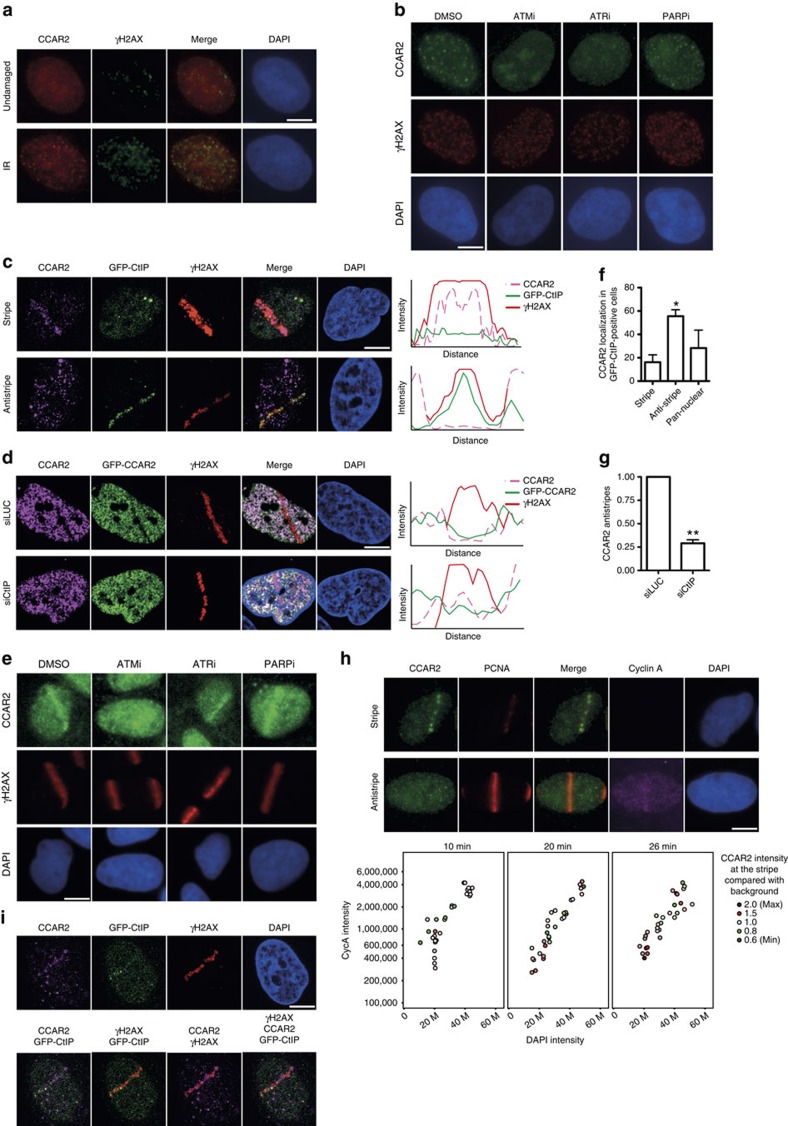
Figure 3. Opposite recruitment of CCAR2 and CtIP to damaged chromatin.
(a) CCAR2 (red) and the phosphorylated form of H2AX (γH2AX; green) were immunodetected in cells untreated or exposed to 10 Gy of IR. (b) Cells pretreated with inhibitors against ATM (ATMi), ATR (ATRi), PARP (PARPi) or DMSO as a control were irradiated and used for immunofluorescence against CCAR2 and γH2AX. (c) Cells expressing a GFP–CtIP fusion were microirradiated. CCAR2 recruitment or exclusion from damaged chromatin was determined with an anti-CCAR2 antibody (magenta). Damaged DNA was visualized using an antibody against γH2AX (red). CtIP was observed as accumulation of GFP signal. The intensities of the signals of the CCAR2 antibody, GFP-CtIP and γH2AX were determined by an orthogonal line that crossed the damaged chromatin and plotted. (d) Same as in c, but in cells bearing a GFP-CCAR2 construct and transfected with siRNA against CtIP or luciferase, as indicated. (e) Same as in c, but cells were pretreated with the mentioned inhibitors. (f) Percentage of cells with GFP–CtIP recruitment that showed recruitment, exclusion or pan-nuclear staining of CCAR2. The average and s.d.'s of three independent experiments are shown. Statistical significance is marked with one to three asterisks, as described in the Methods section. (g) Number of CCAR2 antistripes upon depletion of CtIP. Data were normalized with an siLUC. The average and s.d. of three independent experiments are shown. (h) Cells were harvested at the indicated times after laser microirradiation and stained for PCNA (red), CCAR2 (green), Cyclin A (magenta) or DNA (DAPI; blue). The nuclear intensity of the DAPI and Cyclin A of individual cells (represented as coloured circles) was measured and plotted to follow cell cycle progression. The intensity of CCAR2 at damaged chromatin (automatically detected as PCNA stripes) was compared with background levels and plotted in red (intensity at the laser tracks over background; that is, CCAR2 stripes) or green (intensity at the laser tracks below background; that is, CCAR2 antistripes) according to the legend. Representative images are shown on top. (i) A representative cell with both CtIP (green) and CCAR2 (magenta) stripes is shown. γH2AX is shown in red. Images merging two or three colours are shown. In all panels, scale bars, 7.5 μm.

