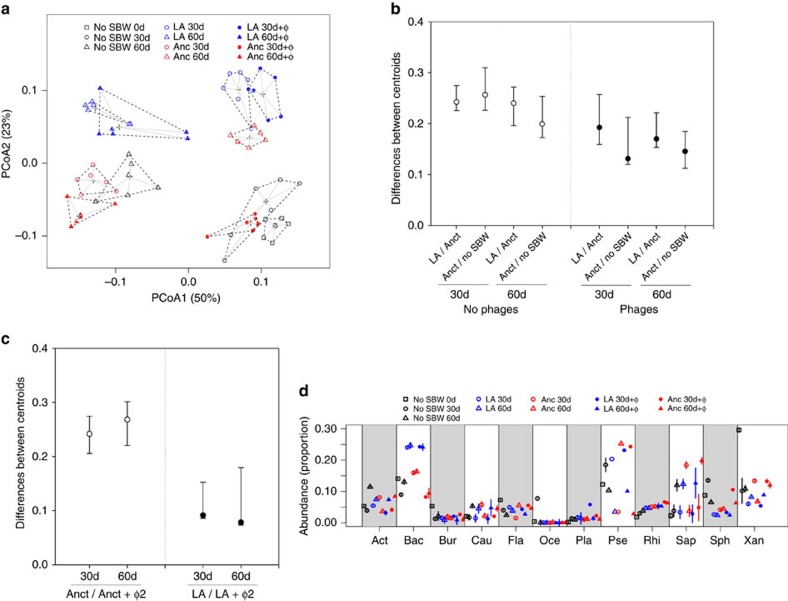
Figure 3. Changes in community composition.
(a) Principal Coordinate Analysis (PCoA) plot of communities based on UniFrac distances. The percentage of variation explained is shown on each axis (calculated from the relevant eigenvalues). Replicates within treatments and time points have similar community compositions, while there are notable differences between treatments and time points. (b) Points show mean (95%±confidence intervals (CIs)) distances between treatment centroids at 30 and 60 days in the absence (open circles) and presence (closed circles) of phages. These centroids are the mean position of all the points in all coordinate directions from the PCoA plot, and their differences reflect the effect of adaptation and species presence on community change. The difference between ancestral and locally adapted treatments shows the magnitude of the effect of adaptation, while difference between presence and absence of SBW25 shows the magnitude of effect of species presence. (c) Points show mean (95%±CIs) distances between treatment centroids to show how phages (+φ2) affect community structure in the presence of either ancestral or evolved SBW25. (d) Common bacterial orders across treatments (>5% in at least one treatment–time point combination). Note consistently high frequency of Bacillales (Bac) across time in evolved SBW25 treatment. Act, Actinomycetales; Bur, Burkholderiales; Cau, Caulobacterales; Fla, Flavobacteriales; Oce, Oceanospirillales; Pse, Pseudomonadales; Rhi, Rhizobiales; Sap, Saprospirales; Sph, Sphingobacteriales; Xan, Xanthomonadales. Square represents day 0, circle represents day 30, triangle represents day 60; black represents No SBW25; blue represents locally adapted (LA), red represents ancestral (Anct); open symbols indicate no phage, closed symbols indicate with phage (+φ).

