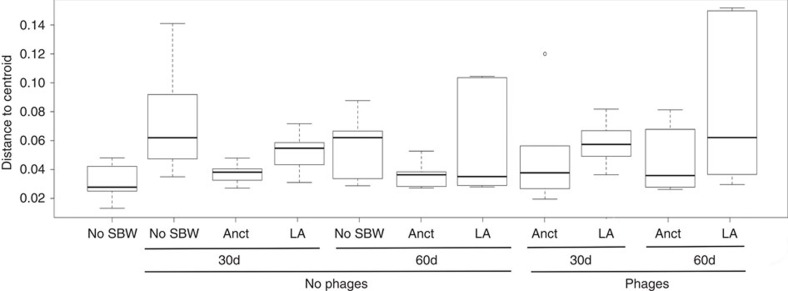
Figure 5. Beta diversity.
Box plot representation of the values of the distances to centroid for treatment–time point combinations; No SBW25, ancestral (Anct) and locally adapted (LA) treatments at 30 and 60 days in the absence and presence of phages, based on UniFrac distances. The box plots show medians (horizontal line in box), 25 and 75% quartiles, and max/min values, outliers marked as circles.

