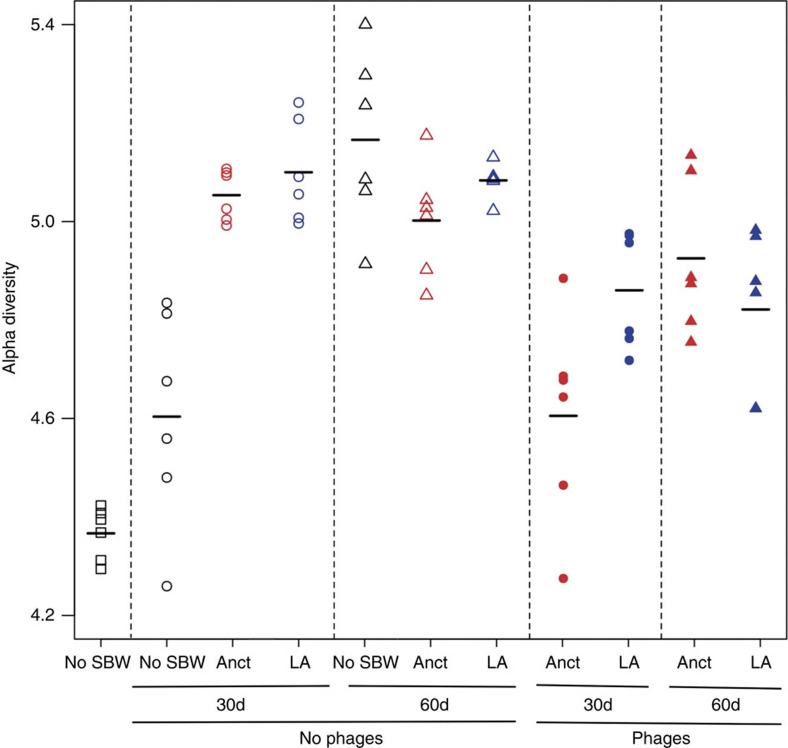
Figure 6. Shannon diversity index.
Representation of the within-population diversity values of the community from No SBW25, ancestral and locally adapted treatments at 30 and 60 days in the absence and presence of phages. Square represents day 0, circle represents day 30, triangle represents day 60; black represents No SBW25; red represents ancestral (Anct); blue represents locally adapted (LA); open symbols indicate no phage, closed symbols indicate with phage (+φ).

