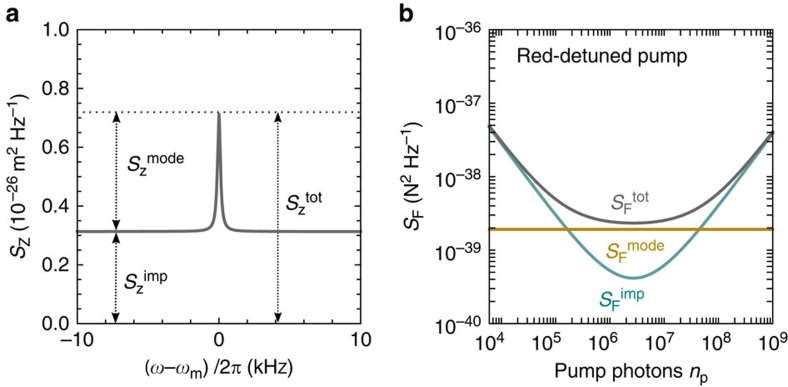
Figure 1. Mechanical displacement and force sensitivity.
(a) Mechanical displacement spectrum Sz close to the mechanical resonance frequency ωm/2π. The total displacement spectral density  at ωm is the sum of the displacement noise
  and the displacement imprecision
  . (b) Corresponding force sensitivity
  (dark grey). The individual components are the thermal force noise
  (dark yellow) and the imprecision force noise
  (turquoise), given by equations (1) and (2), respectively. The quantum back-action noise is neglected for simplicity. For the plots most of the parameters are those of device B, but we estimate the mass assuming that the graphene flake is a single layer. Further we choose nadd=0.5, Tbath=0.015 K, and np=2·105 in a (see text).

