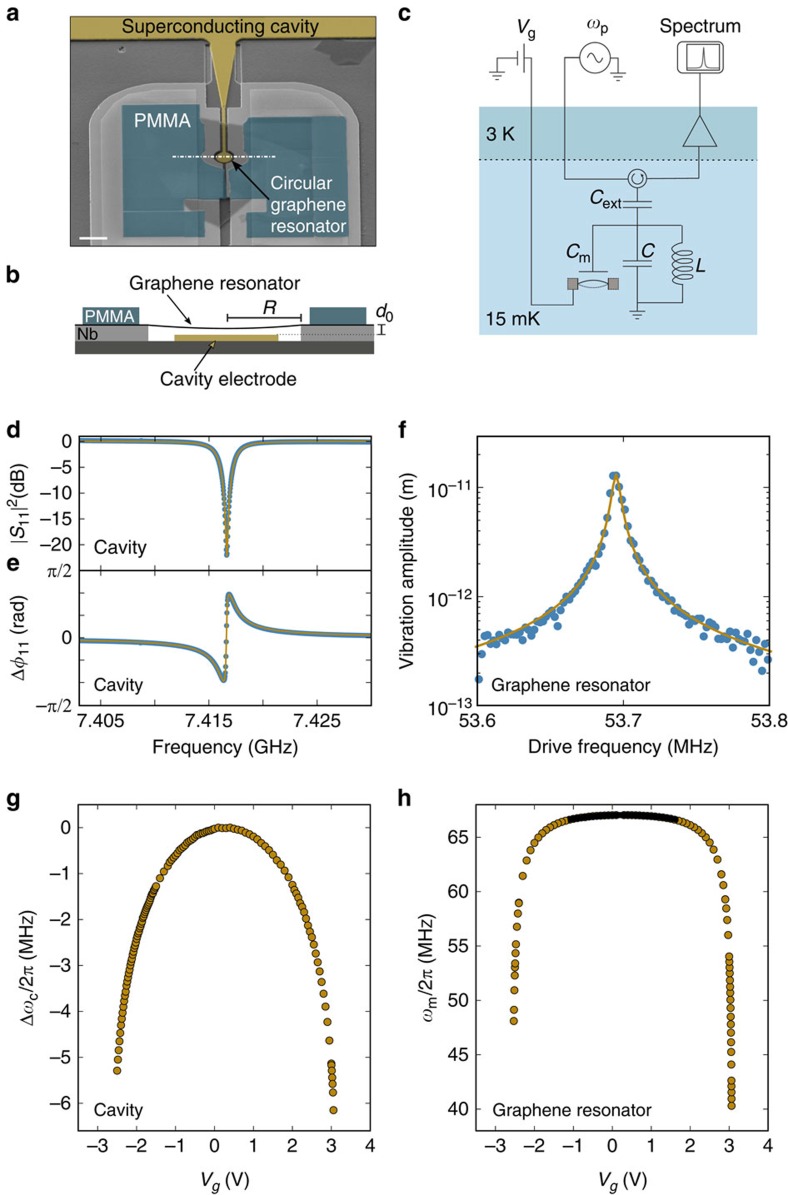
Figure 2. Device and characterization.
(a) False-colour image of the device. The cavity is coloured in dark yellow. The graphene flake is clamped in between niobium support electrodes (grey) and cross-linked poly(methyl metracylate) (turquoise). The scale bar is 5 μm. (b) Schematic cross-section of the graphene resonator along the white dashed dotted line in a. (c) Schematic of the measurement circuit. The graphene mechanical resonator is coupled to the superconducting LC cavity through the capacitance Cm. The separation d between the suspended graphene flake and the cavity counter electrode is controlled by the constant voltage Vg. The cavity is pumped with a pump tone at ωp and the output signal is amplified at 3 K. (d) Reflection coefficient |S11|2 and (e) reflected phase Δφ11 of the superconducting cavity of device A at Vg=3.002 V. The dark yellow lines are fits to the data using κint/2π=950 kHz and κext/2π=850 kHz using equation (7) (see Methods). (f) Driven vibration amplitude of the graphene resonator of device A as a function of drive frequency. The driving voltage is 22 nV and Vg=3.002 V. The dark yellow line is a lorentzian fit to the data. (g) Resonant frequency ωc/2π of the superconducting cavity as a function of Vg. (h) Resonant frequency ωm/2π of the graphene resonator as a function of Vg. The black line is the Vg dependence of ωm expected from electrostatic softening (see Supplementary Note 1).

