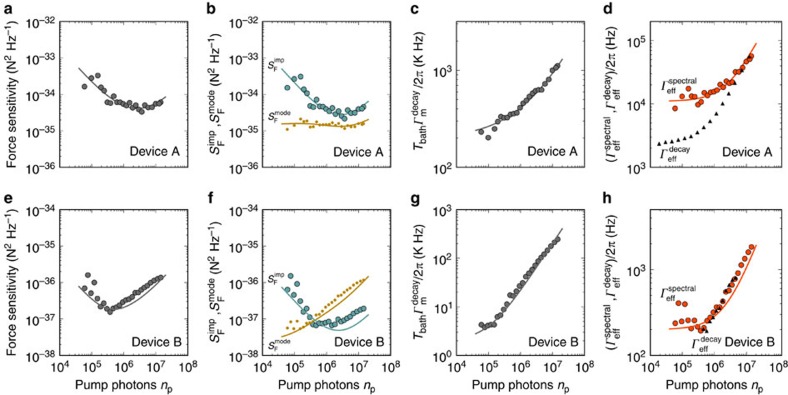
Figure 5. Characterization of the force sensitivity.
(a) Force sensitivity  as a function of cavity pump photon population measured when pumping the cavity on the red sideband. (b) Imprecision force noise
  (turquoise) and thermal force noise
  (dark yellow) versus np. The data in a,b are fitted to equations (2), (6). (c) Product of the bath temperature Tbath and the intrinsic mechanical decay rate
  as a function of cavity pump photon occupation. The line is a fit to the data. (d) Effective spectral mechanical line width
  and energy decay
  as a function of np. The data are fitted to
  with δΓnoise/2π=8.7 kHz (red line). (e–h) Equivalent to (a–d) but for device B. The lowest value for the force sensitivity in e is
  . In e and f the data are fitted with nadd=22 and in h we use g0/2π=7.3 Hz, κ/2π=2.5 MHz and δΓnoise/2π=0.145 kHz. All the measurements on device A are performed at Vg=3.002 V and on device B at Vg=0 V. The cryostat temperature is 15 mK.

