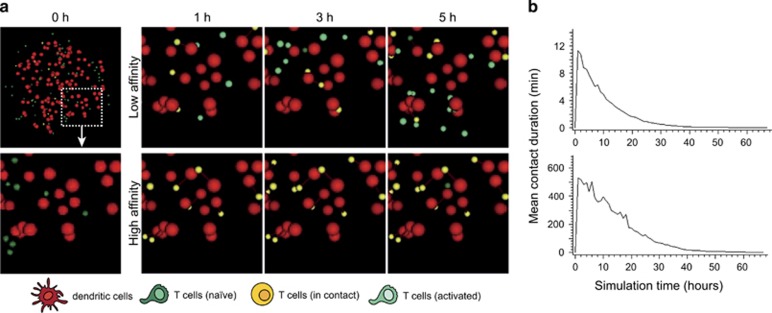
Figure 2.
Modeling T-cell synapses and kinapses in the virtual lymph node model. (a) Time-lapse images from simulations run for T cells recognizing a low- versus a high-affinity peptide. DCs are shown in red. Naive T cells in dark green. T cells forming a productive contact with a DC (either a synapse or a kinapse) are shown in yellow. T cells that have collected activation signals are shown in light green. T cells interacting with DCs presenting the low or the high-affinity antigen results in the formation of kinapses or synapses, respectively. (b) The graphs show the mean contact duration established by T cells during the course of the simulation.

