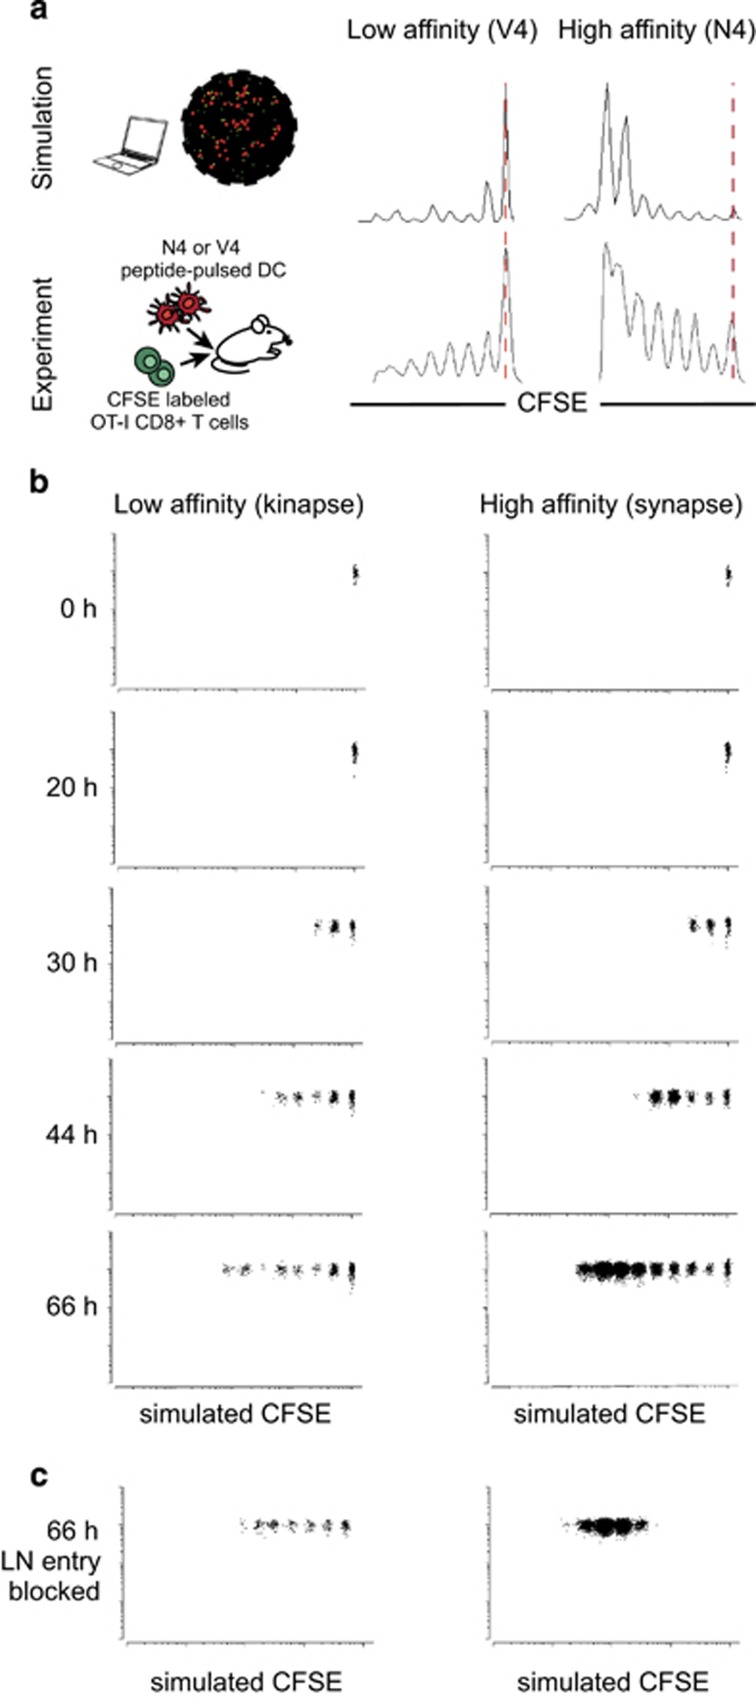
Figure 3.
Dynamic monitoring of T-cell proliferation generated by synapses and kinapses. (a) Comparison of T-cell proliferation measured experimentally in vivo by flow cytometry or simulated using the virtual lymph node model. For in vivo experiments, N4 or V4 peptide-pulsed DCs were injected in the footpad, whereas CFSE-labeled OT-I T cells were injected intravenously. At 66 h, lymph node cells were subjected to flow cytometry. (b) CFSE dilution profiles were generated for different time points of the simulation in conditions of low- or high-affinity peptide. (c) Simulation was run in conditions where T-cell entry into the lymph node is blocked.

