
Figure 7.
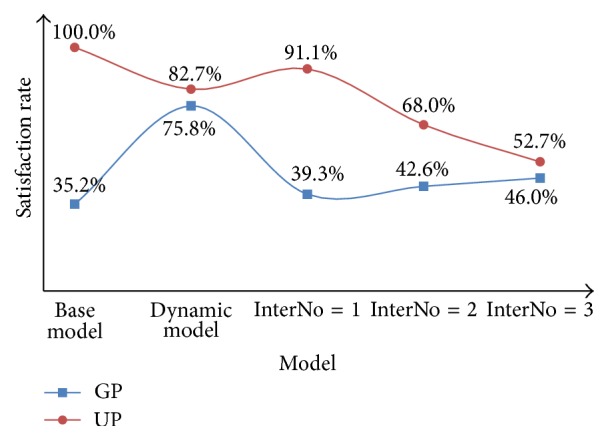
Comparison between the base model, the dynamic priority model, and the fixed priority model for GPs and UPs in terms of satisfaction rate.
Official websites use .gov
A
.gov website belongs to an official
government organization in the United States.
Secure .gov websites use HTTPS
A lock (
) or https:// means you've safely
connected to the .gov website. Share sensitive
information only on official, secure websites.
Comparison between the base model, the dynamic priority model, and the fixed priority model for GPs and UPs in terms of satisfaction rate.