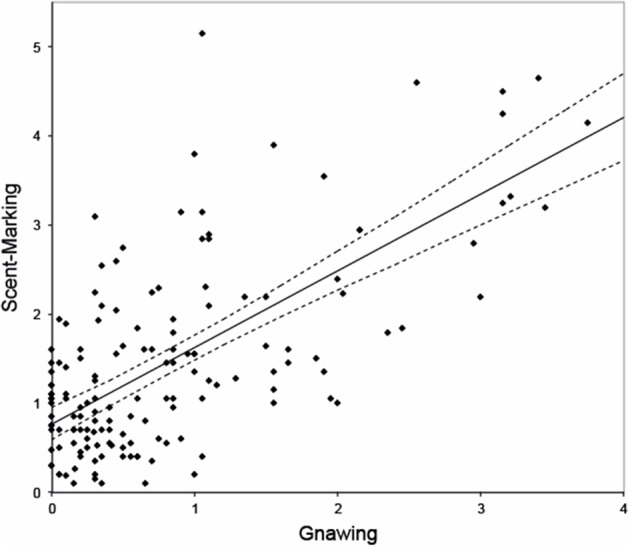
Figure 1.

Relationship between gnawing (frequency per animal per session) and scent-marking (frequency per animal per session). Dashed lines represent 95% confidence intervals. Note that the regression line here only serves as a graphical representation, though as it is based on an overall effect with multiple data-points per monkey it does not reflect the reported model.
