Figure 2.

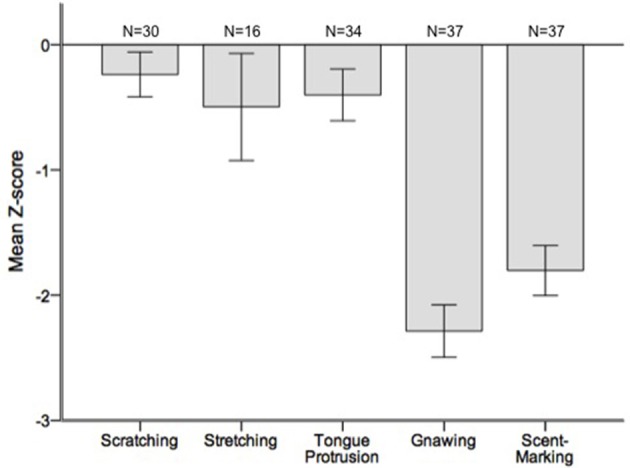
Mean ± SEM Z-scores from the runs tests performed for each of the testing sessions. The number of testing sessions included in the analysis is indicated above for each behavior.

Mean ± SEM Z-scores from the runs tests performed for each of the testing sessions. The number of testing sessions included in the analysis is indicated above for each behavior.