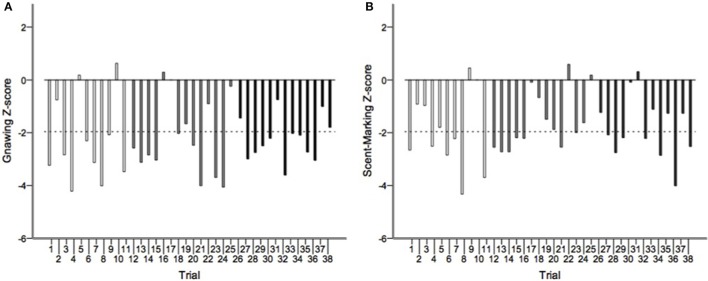
Figure 3.
The distribution of Z-scores from the runs test analyses for (A) gnawing and (B) scent-marking across all morning (white), midday (gray), and afternoon (black) testing sessions. The dotted line indicates the threshold for significant temporal clumping within a session (Z < −1.960, P < 0.05). This was breached 26 times for gnawing, and 19 times for scent-marking.

